The Scandal of the Scottish Met Office Station Still Providing Temperature Figures Six Decades After it Closed
Another shocking example of decades-long invented temperature figures at non-existent UK Met Office measuring stations has come to light. The Lephinmore ‘station’ was situated in the upper reaches of the Firth of Clyde, and according to the “location-specific long-term averages” Met Office database it can supply monthly temperature readings along with rainfall amounts going back to 1960. This supply can be considered a modern scientific wonder given that the actual station closed five months before England won the World Cup in 1966.
The usual form when the Met Office is asked to provide further and better particulars on its invention techniques is for the explanation to be given that batches of figures from “well-correlated neighbouring stations” are modelled by a computer. But in the case of location-specific station Lephinmore, there are no neighbouring stations, well-correlated or otherwise.
The three nearest with any long-term records are CIMO Class 4 ‘junk’ station Dunstaffnage at 27 miles distance, Class 4 Glasgow Bishopton 29 miles away, and the Class 4 airport site 45 miles away at Prestwick Gannet. A station called “Bute: Rothesay” is said to be 18 miles away but this closed some time ago. A new station “Bute: Rothesay No 2” opened in 2012 and this is also in the Class 4 junk portfolio. The considerable distances involved and the ‘junk’ nature of all the sites with internationally recognised uncertainties of up to 2°C, would appear to rule out well-correlation for either a single ‘station’ or a fudged ‘location-specific’ claim.
Not to put too fine a point on it, the idea that an airport site can provide scientific information about likely temperature and rainfall conditions at a rural location 45 miles away is little short of risible. A Class 4 site is unable to give a true ambient air temperature in its own backyard, let alone one tens of miles distance.
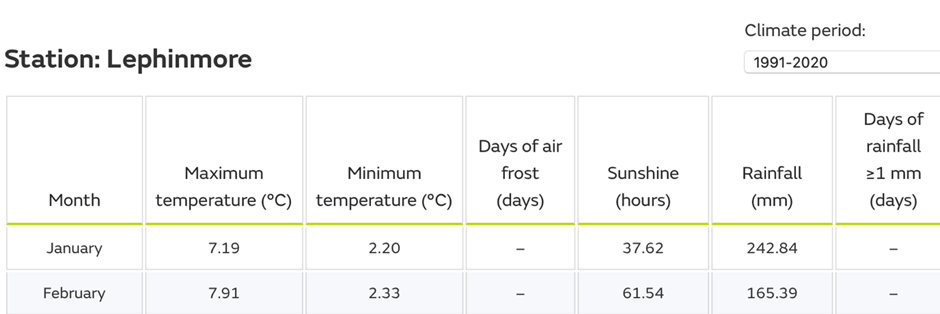
This is what is claimed on the Met Office’s public access “location-specific long-term averages” database for Lephinmore. Two option are available to track 30-year average monthly totals from 1961-1990 and 1991-2020. As noted, it is truly a wonder of modern meteorological science that maximum and minimum temperature averages can be calculated from so far away to one hundredth of a degree Centigrade. And local rainfall to two decimal depth points. Such precision indeed!
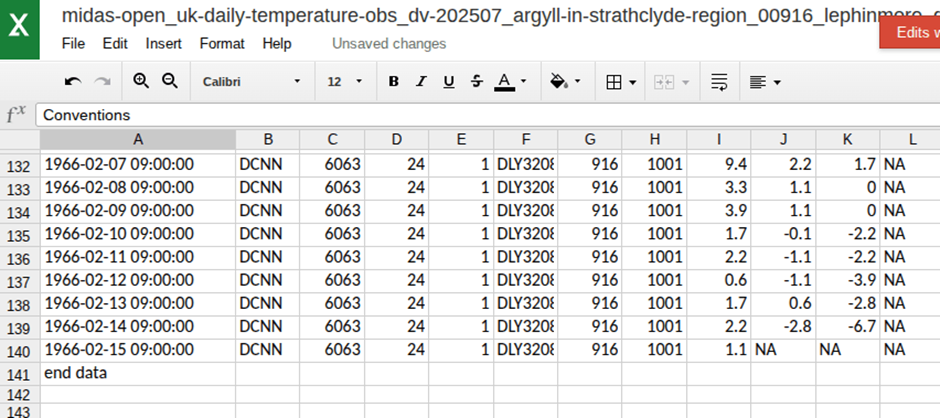
Citizen super sleuth Ray Sanders has been on this case along with many other ‘smoking guns’ during the course of his forensic examination of the Met Office’s records and claims. He also presented proof of the closure of Lephinmore from February 15th 1966.
After over a year of digging into the state of the Met Office’s temperature network along with the statistics it produces and the modelling that supplies reams of invented data, Sanders is not inclined to be charitable. “An alternative view of this climate averaging system is that it is a work of complete fiction… it is an insult to the public’s intelligence and demonstrates a complete disregard for even the tiniest vestige of scientific credibility,” he suggests. Needless to say, the Met Office takes a different approach, charging that the investigative efforts of a small number of people are “an attempt to undermine decades of robust science around the world’s changing climate”. Unfortunately, the Met Office seems to live in the Net Zero-inspired world of ‘settled’ climate science. It appears blissfully unaware that real world science is only “robust” when it emerges intact after relentless and forensic examination.
The “location-specific long-term averages” database was until recently called “UK climate averages”. It invited the public to select an individual climate station to provide a selected 30-year average. But Sanders revealed that more than a third – 103 out of 302 – of the stations promoted, complete with their supposed coordinates and elevations, did not exist. A hasty rewrite then followed from the Met Office and this explained that the invented data arose from ‘locations’ which may or may not bear any relation to stations that once existed, or indeed exist today. Despite this, as the image above for Lephinmore shows, the data still appear for a named “station”.
A subsequent Science Feedback ‘fact-check’ that seemed to have been largely written by the Met Office said the average data for the closed stations was not “fabricated” but estimated using “well-correlated neighbouring stations”. It’s an explanation for the inventions but as we can see in the case of Lephinmore, the lack of nearby stations, well-correlated or otherwise, draws yet more questions.
Subsequent “undermining” questions from the few then put the cat among the pigeons in the case of Lowestoft. This station was one of only 37 supplying information for a separate “historical” database but it closed in 2010. Lowestoft does not have any well-correlated stations nearby – the nearest are over 35 miles away – a fact confirmed in a Daily Sceptic Freedom of Information (FOI) request. For Lowestoft, the Met Office then claimed that it did not use “well-correlated neighbouring stations” and a different explanation was supplied: “We used the gridded value from the closest grid point from our UK climate dataset HADUK-Grid.” But this explanation does not seem to take the curious – if not downright cynical – investigator very far, since the HADUK-Grid uses “well-correlated neighbouring station” data derived from the Met Office’s Integrated Data Archive System (MIDAS) to model infill data for closed stations.
Whatever is going on, the Met Office removed the Lowestoft invented data from 2010. Perish the thought that anyone should think this station as an infilling “well-correlated neighbouring station” – or not as the case may be – would cascade fake figures throughout databases using modelled temperature information, corrupting the ‘records’ as it went. Conveniently added at the time to the public explanation on the historic database was a short note that read: “The purpose of this webpage is to provide a sample of historical station data across the UK for general interest. It is not used for formal climate monitoring.”
Meanwhile, doubts have started to emerge about some of the Met Office’s rainfall claims, used invariably to promote the Net Zero fantasy. Its recent claim that Worcestershire recorded its wettest February since records began in 1835 has been effectively debunked by the great, long-time climate sceptic Paul Homewood following FOI requests. He found convincing evidence from historical records that more rain fell in the area in February 1923. “Is British weather really getting wetter as they claim. Or is it just a figment of their computer’s imagination?” he asks.
Chris Morrison is the Daily Sceptic’s Environment Editor. Follow him on X.
To join in with the discussion please make a donation to The Daily Sceptic.
Profanity and abuse will be removed and may lead to a permanent ban.
The of the basic characteristics of the ideologically possessed (e.g. the Met Office) is not to notice or account for contrary information. What’s even odder about the Met Office, though, is that it imagines that no one else will notice what it has decided not to notice.
How does anyone know that these stations are “well correlated”? Surely the only way to know that is to, er, measure the temperature?
Exactly – perhaps they could establish a weather station there for that purpose…? Oh hang on….
Settled science simply means “We’ve got an agenda and no amount of science or reality is going to change that”.
To the Met Office, every day is April 1.
The Met Office is a shameless organisation. They have been misleading the public for so long now that it has become 24/7 routine. Any alternative views are met with ‘fingers in ears’ and shouts of “la la la we’re not listening”!
No emplyee would dare question these (blatant) lies anymore, as it would be ‘career’ ending.
I guess there are a large number at the Met O for whom it is just a job and then there are the ideological eco-activists who are committed to creating the fake Global Warming agenda.
Global temperature, inflation, GDP, global crude oil price – all completely fake data.
You’d have thought, having been caught red-handed, that the met office would install rigorous stations to confirm their data – why are they not doing this?
Probably because the people that matter – and that is not us – still believe them or are happy to use their fake data for their fake climate change scam.
There are lies, damned lies and statistics.
And then there is the Met Office …. which invents the data; lies about it; creates fantasy statistics and then lies about the process.