Dramatic Fall in Global Temperatures Ignored by Narrative-Captured Mainstream Media
Global temperature anomalies on both land and sea are dropping like a stone. Net Zero-obsessed mainstream media, science and politics do not do cooling. Confirmation bias that holds humans responsible for hockey-stick style global warming with all its risible ‘settled’ notions has gravely damaged genuine climate science. But the world is cooling rapidly and the silence from the mainstream is both laughable and disgraceful.
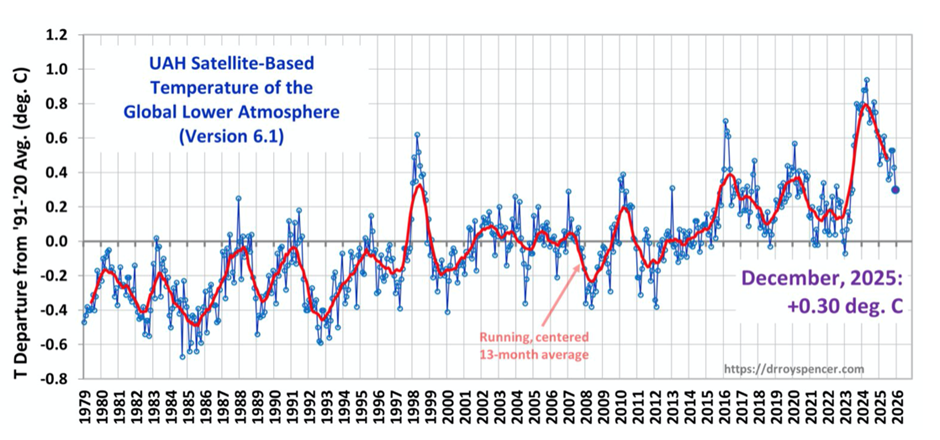
Exhibit 1: The accurate UAH satellite record shows the plunge clearly with the difference or anomaly from the 1991-2020 average falling during 2025 to end the year at just 0.3°C.
Needless to say, mainstream media ignore satellite temperature data. In January 2022 at the height of the Greta climate hysteria, Google AdSense banned a page promoting the monthly update on the grounds of publishing “unreliable and harmful claims”. In the UK, the stone-dropping global inconvenience was passed over recently in favour of highlighting the latest hooey from the Met Office claiming another local ‘hottest year evah’ based on its junk, unnaturally heat-ravaged weather stations. Rather than advance a balanced global view (or even mention it), the Met Office activists proclaimed that its six hundredth of a degree centigrade ‘record’ was made 260 times more likely due to humans fiddling with the weather. Such imaginative precision from such junk data is a wonder to behold. Science, it is not.
The UAH scientists, Dr Roy Spencer and Professor John Christy, also produced results showing how the monthly temperature anomalies have fallen over the last two years. The table below shows both a global figure and measurements broken down in a number of regions.
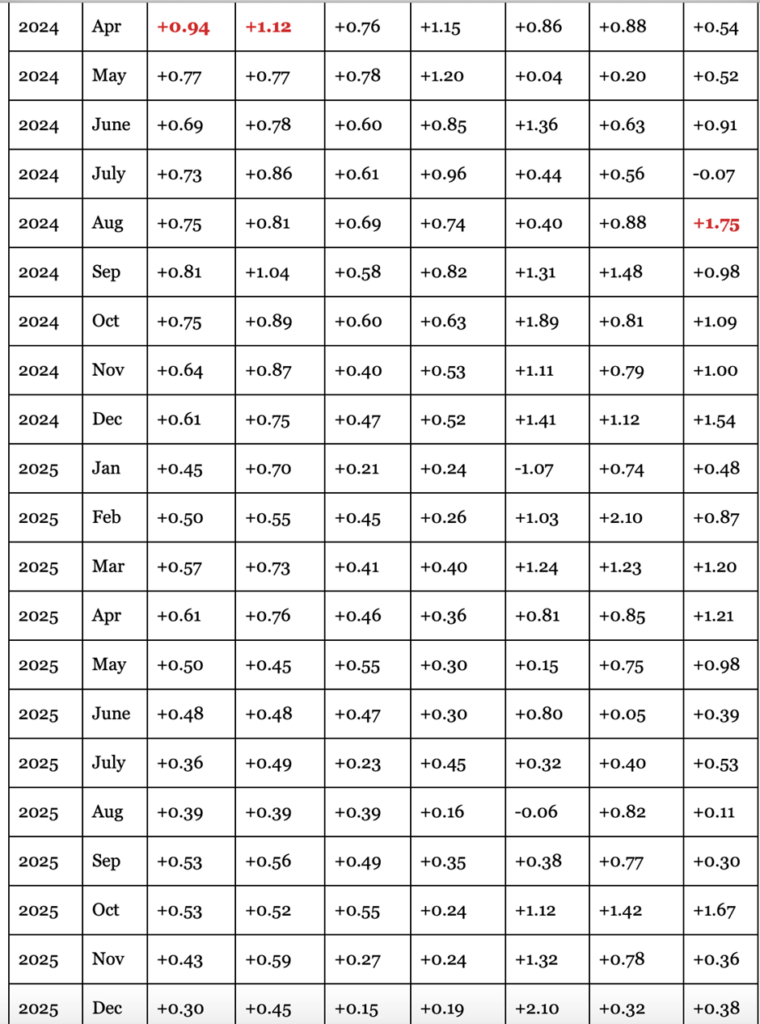
To the left, the red global anomaly in April 2024 was a two-year high, as was the figure next to it for the northern hemisphere. The other columns continuing from the left are the southern hemisphere, tropics, mainland US, the Arctic and Australia. Across all regions, a downward trend can be clearly seen.
Exhibit 2: Along the equatorial Pacific Ocean, sea surface temperatures (SSTs) have been falling for months. In its recent report on the formation of El Niño (warming) and La Niña (cooling) oscillations, the US weather service NOAA provides the latest three-month running anomalies. Since last September, NOA notes “below average SSTs persist across most of the equatorial Pacific”.
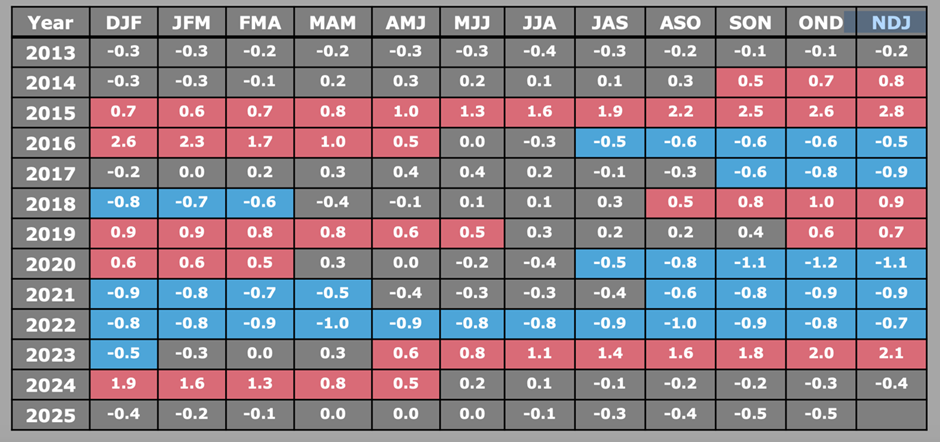
Note the warming oceans around 2015-16 caused by a particularly strong El Niño. The recent El Niño also caused warmer oceans, or ‘boiling’ to accurately report the sentiments loudly bloviated by the Guterres/Gore/Kerry gang.
This is the latest graph showing SSTs from 60°S to 60°N.
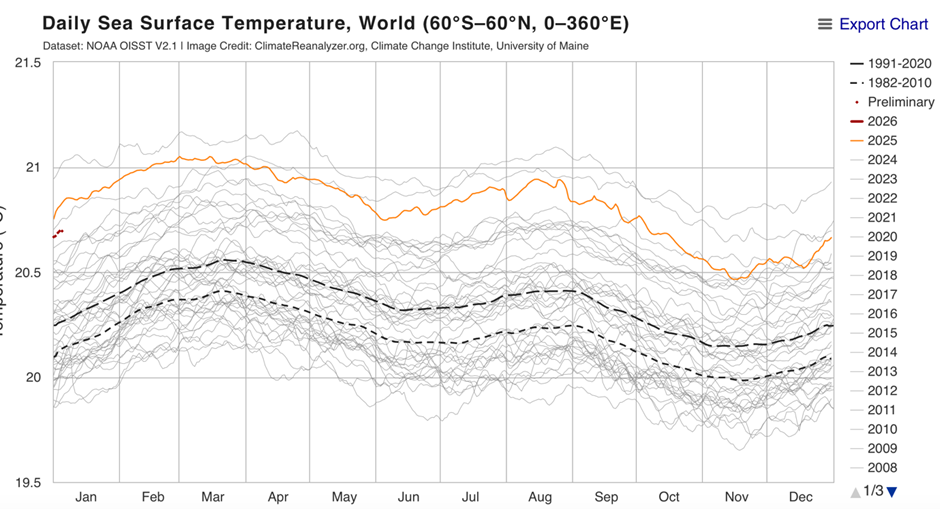
Again, it seems temperatures are coming off the boil, with 2026 starting cooler than 2025, which was cooler than 2024.
The last few years have witnessed extraordinary climatic events combined with astonishing levels of scientific disinterest in the causes of them. The ‘agreed’ answer of course was always to hand – it was humans wot did it, we have the computer models to prove it. And if you don’t agree with us, then don’t slam the door behind you. Writing recently on Judith Curry’s blog, Javier Vinos wrote that what he termed the 2023 event revealed the “greatest failure of climate science”. Vinos is a leading proponent of the suggestion that the massive underwater Hunga Tonga volcano eruption in 2022, which increased water vapour in the upper atmosphere by up to 13%, was the prime cause of all the weather anomalies. Water vapour is a powerful warming gas of relatively short duration.
The scale of the massive increase in stratospheric water vapour can be seen in the latest measuring chart from NASA shown below. There is still a lot of extra water compared to the years before 2022, but it is gradually decreasing.
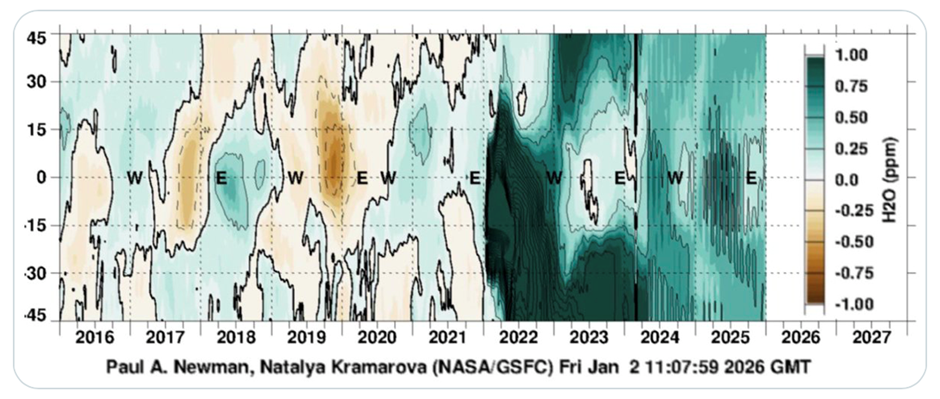
Activists jumped on all the unusual weather events to promote a politically acceptable, pre-defined narrative. But the large blips since 2023 cannot be explained by anthropogenic causes since such changes if they occur are small, regular and only noticeable over a long period of time.
The reason climate science in general has failed to rise to the discovery challenge over the last few years, observes Vinos, is due to strong confirmation bias. “The first step to learning from the 2023 event is accepting its exceptional nature, which many fail to do,” he argues. Rather than trying to determine the causes of the event, scientists have attempted to fit it into the dominant narrative using models, he charged. Vinos’s contribution makes interesting reading and offers a convincing argument to lay much of the blame for the recent dramatic but temporary climate changes on an event unique in the recorded record. Unlike Hunga Tonga, most onshore volcanic eruptions emit large quantities of particles into the atmosphere which can lead to temporary but noticeably global cooling. Meanwhile, Vinos states that “climate science has failed the test of an externally forced natural climate event”.
The great tragedy of the settled climate science era, now facing increased scrutiny, is the draining of public confidence in once revered scientific institutions. Covid was hardly a high point in medical science, while climate fear mongering is in danger of becoming a social joke. ‘Boiling’ oceans and constant risible records are mixed with obvious pseudoscience such as human ‘attribution’ claims. The blast from Hunga Tonga may well help in blowing away much of this fake news for good.
Chris Morrison is the Daily Sceptic’s Environment Editor. Follow him on X.
To join in with the discussion please make a donation to The Daily Sceptic.
Profanity and abuse will be removed and may lead to a permanent ban.
To my eye, that first graph still shows a gradual general upward trend over this 47-year period. That is not to say that I believe anthropogenic climate change to be the driver, nor that it justifies the economic suicide the Net Zero mob want the West to commit. How useful it would be to have such figures for a 200-year period, but sadly they didn’t have satellites back then.
There are branches of the “Net Zero mob” that see it as an economic opportunity, not suicide, and they consider that they are doing a lot of good work for us.
For them – not for us. We are a bug in an otherwise perfect system, not a feature, and need to be eliminated.
Even those who honestly believe that they must (and could) save “the planet” from a catastrophe which exists only in their own paranoid delusions probably want to save themselves and the rest of mankind, especially “climate deniers”, not so much. And I’m not convinced that such people exist, at least not at the level where the decisions are made and the slogans created. They cannot seriously be so stupid that they believe that The Europeans must pay for the historic sins while developing countries are free to do whatever they want
can save “the planet” from a CO₂-induced apocalypse because CO₂ molecules don’t carry labels documenting their origin the climate could use to determine if it should freak out because of them or ignore them happily.
Don’t forget that the graph you mention includes the cooling that was evident in the late 1960s and 1970s that came on the back of the hotter 1930s and early 1940s, of course we had no satellite observations in those earlier decades.
But they had rural temperature records and these show a wildly different picture to the globalist psyop that the media are dutifully regurgitating for us.
For the last 200 years we have also been coming out of a mini ice age so a natural mild uptick in warming would be expected. During my lifetime for example I have never seen anyone ice skating on the Thames.
Anthony Watts’ surfacestations.org had people verifying rural weather stations in the US (far fewer now used, far MORE UHI ridden urban ones) and gauged the temperature over the past 50 years
Cooling…
Good point, but remember that the Thames back then did not have its Victorian embankments, so the river would have been shallower and consequently slower-flowing.
Absolutely correct
Wrote my comment before seeing yours !! Great minds?
True but the overarching point is the winters were far colder.
The Thames was embanked during the Victorian era ergo deeper and narrower. The frosts and ice skating was on a wider shallower Thames or so I understand.
The issue is not that there is a rise, the issue is what is the cause. If you eyeball 1966 to 2016 on the graph, the slope is flat, and from 2003 to 2013 it is a decline. If CO2 emissions from fossil fuels drive global temperatures, how can they do it more some years, stop for a while, then less in others? ( If you press the accelerator in your car, would it accelerate for a while, then stop accelerating for a bit, then slow the car down? ) That just isn’t possible. And that graph isn’t actual temperature, it’s an anomaly – a number – derived from data that is ”adjusted” and compared to a chosen (how/why?) baseline set to zero in a range of -0.8C and + 0.8C. Satellite sensing uses infra-red or microwave which are affected by atmospheric conditions so need to be “corrected”. It does not produce data, just numbers out of a mathematical calculation. So “global warming” is an “argument about small fractions of a degree, which in any case are impossible since the input data at best is accurate to no more than +/-2C. This means the “anomaly” is created within the mathematical… Read more »
Yes that’s true it seems to be around 0.8 °C over some 45 years, so not negligible, but not particularly alarming; and almost certainly not caused by driving cars or using electricity, eating meat or going on holiday.
At a climatic level it seems to me totally pointless to look at such a small window of time, ideally you need temperature sets covering at least a couple of thousand years to see any recent fluctuations in context.
The whole graph covers only a temperature change of 2⁰C and the recorded variations encompass only about 1.5⁰C in total. That’s much less than the usual temperature difference between night and day during most of the year in the UK (for Reading today, it’s 6⁰C between highest daytime and lowest nighttime temperature according to the Met office forecast which is four times as much).
Hence, while your observation is correct, when looking at the actual scale of the changes, the conclusion can only be: These are miniscule fluctuations humans cannot even notice without measurement instruments and dwarfed by perfectly normal natural changes. This doesn’t matter, no matter what causes it. Especially considering that they we don’t and cannot know that.
People who come up with elaborate theories about stuff which doesn’t matter ought to be ignored as weirdos, no matter what they themselves believe about the importance of their theories.
Yes. Me too. There is a discernible upward trend with several decadal anomalies of temperature drops. You cannot use this graph to explain to Joe and Jean public that the temperature is falling.
It would be best to not use this graph at all because it’s completely meaningless: It shows variations relative to an arbitrarily picked average of a set of already meaningless averages.
A sensible assessment of “global temperature changes” would at least need a 2D¹-representation: Create a set of temperature bands with actually meaninful differences (at least 2⁰C, probably better 5⁰C) and then count how many stations reported a temperature in which band. After having amassed a sensible number of such temperature historgram, eg, some 20 – 40² years worth of data, look for changes.
¹ 3D would probably better as temperature varies throughout the day, even better 4D as it also varies throughout the year. But that couldn’t be visualized without some trickery.
² While that’s a pretty long period for humans, it’s laughably small for geological events.
It goes up, it goes down. Has done for millennia.
Billenia!
However millions of years ago (Carboniferous Era) global temperatures were estimated to be much much warmer than today.
In short, the climate has always changed and life has had to adapt.
All I know is that it’s very cold in space.
And Mars ain’t the kind of place to raise your kids.
And no one can hear you scream…..
Surely Elon can
250 F on the light side of the moon where the fake Apollo missions played golf
Only 1000 F on Venus
Only 70 F on parts of Mars
AGW is to blame
The support “evidence” in the 1990s, was the clear correlation between fossil fuel CO2 emissions and rate of increase of global warming.
OK – we know. Correction does not prove causality, but if there is a causal relationship there must be correlation.
What is being overlooked by many is that after 1996 that correlation stopped. For over ten years there was no increase – The Pause™️ – after which a slight decline.
No correlation, no causal link. Gasp!
All change… global warming becomes climate change.
Climate change predictions fail. All change… rebrand – Climate emergency/crisis.
The term “Climate Change” is totally meaningless, a facile, empty and fatuous statement.
Climate change is real – what does that actually mean? Rain is real, water is real, grass is real. Just stating that something (climate) changes is hardly Earth shattering, temperature changes, light level change, precipitation changes. No-one suggests any of this is in a state of stasis and is not changing, if temperature goes up. or down, its changing.
Of course, what’s not stated is what they actually mean when they say “Climate Change”, what they actually mean is “Mankind’s reckless use of fossil fuels” is real, or something very similar, but whatever, its definitely our fault.
At least Global Warming was meaningful, if unproven.
At least the US has just withdrawn from the ‘holy’ IPCC.
On the WUWT website Charles Rotter put it this way which pretty much sums the IPCC up.
‘Many of these entities long ago ceased to resemble neutral forums for cooperation. Instead, they operate as financial pass-throughs and narrative enforcement mechanisms, shielding explicitly Marxist or post-Marxist economic assumptions behind the moral language of environmental salvation.’
It takes generational shifts foe any consensus to change. We need the current communist scientists to retire and bugger off, before the ‘science’ will change. Or a mini ice age to smack us all in the face.we are due one.
I wrote to the met office on two occasions asking them to explain chem trails, which we witness most days. They responded both times with an identical 3 page document, stating chem trails do not exist and stating, they are contrails!
I have now found out the met office emoloyees must sign the official secrets act. Now, I understand the three page denial of chem trails. The met office is gagged. I wonder why.
I got the same ‘contrails’ answer from my local MP last May, after sending her a video of light planes going back and forth over Milton Keynes. leaving long white diffusing trails behind them. It was the ‘back and forth’ element I emphasised to her. Normal air traffic doesn’t do that, I said, only crop-sprayers and the like. But she wouldn’t have it. Definitely not chemtrails, she said. No such thing is going on, the government wouldn’t allow it.