I’m a Meteorologist. The Met Office Has Serious Questions to Answer Over the Accuracy of its Temperature Measurements
In the 1990s and 2000s the Met Office gradually changed the way it measures the air temperature due to a process of automation, the primary purpose being to reduce costs. Human observers were largely replaced by machines which utilise platinum resistance thermometers (PRT) and data-loggers. This combination led to the possibility of reporting at a much greater frequency. This change has occurred across many other countries. Arguably, this change has had a measurable impact upon daily maximum and minimum temperature reports, which then feeds into longer-term climate reporting, although I am not aware of published research that has assessed the impact of this change (Chris Morrison has reported on this question recently).
We should note that PRT technology is not new — the instruments were invented in the late 19th century and advertised commercially in the very early 20th century. They are generally accurate and have a faster response time than the traditional mercury-in-glass (MiG) and ethanol-in-glass (EiG) thermometers. The glass thermometers contain an internal index to mark the daily extremes, which are read in the morning and evening. For decades PRTs were used alongside the glass thermometers for observing and climate purposes, with the glass thermometers largely responsible for recording the daily highs and lows.
The practice for UK weather-observing staff in the 1980s and 1990s was to record the hourly temperature from the PRT (even half-hourly at busy airports). This had been the practice for many decades. For the climatological return, the MiG was used for the daytime maximum value, which was read at 2100 UTC (Coordinated Universal Time, or Greenwich Mean Time: GMT). The EiG thermometer recorded the night minimum temperature at 0900 UTC. Very rarely, an hourly PRT value would be higher than the daily maximum climatological readings from the glass thermometers (and lower at night). The PRT value would then take precedence in the daily register and climate return for the sake of consistency, but the vast majority of the climatological recordings arose from the glass instruments.
Use of the electric thermometers, combined with the data-loggers, enabled the collection of far greater amounts of data. Readings are now taken every 15 seconds, and four readings averaged over each one-minute period. Because of the faster response time of the PRTs, this has meant that shorter temporal peaks and lows in temperature can be measured. Essentially, short-period highs and lows that would have been missed by glass thermometers are now recorded in the climatological daily returns.
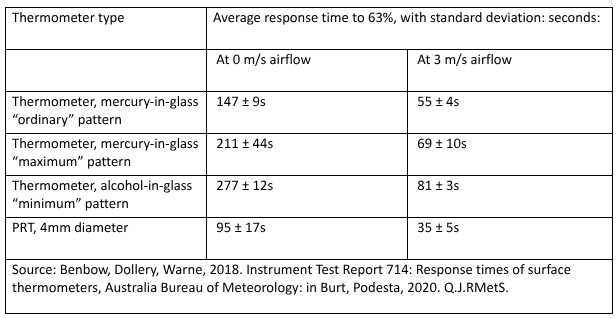
To see the significance of this, the response time of the different instruments can be assessed. As can be seen from the table below, the PRTs have a faster response time than the glass equivalent ones, with the larger difference being at very light wind speeds. The Stevenson Screens are only naturally aspirated, which means thermometers are recording at the lower wind speeds and so response times are longer. It seems likely that the change from the glass thermometers to the PRTs has an impact upon climate returns.
In terms of climatological daily averages for each station, one might think that the higher peaks, and lower lows would cancel each other out. However, the air near ground-level is generally more stable at night than during the day. This means that the glass thermometers have more time to respond to changes in air temperature at night. Thus, it would seem likely that the change in technology has less impact on the measurements at night. During the day, convective currents lead to greater variability in temperature, and likely to the recording of higher short-period daytime maxima (see figure 6 at this Met Office factsheet 17).
Historically, there was a change from the Glaisher temperature stand to the Stevenson screen in the 1870s, and multi-year studies were conducted to assess the difference in readings. The Glaisher stand was not fully protected from long-wave radiation from the ground or nearby buildings, which meant that slightly higher readings were taken in comparison with the ambient air temperature. Studies suggested an average difference of approximately 0.7°C for a summer month (Laing, 1977, Met. Mag.). However, as far as I am aware no equivalent long-term studies have been conducted or published to assess the impact of the change to PRTs and higher frequency readings collected by data-loggers. Jennifer Marohasy has struggled to find information related to this question for an automatic weather station at Brisbane Airport.
The other impact of note is the growth of urban development and the impact this has on daily average temperatures. It is true that many Met Office observing sites are now classed, according to WMO classification, at Class 4 or 5, which suggests larger possible sources of error in daily reports (errors of up to 2 or 5°C respectively). Analysing the Met Office station inspection reports, for example at the Cambridge Botanical Gardens (available in the National Met Archive in Exeter), reveals the struggle the Met Office has had over the years to maintain the quality of its observing sites in the face of urban development. An historical study of the Cambridge Botanic Garden shows the temperature screen has moved several times since the 1950s as development has encroached upon the garden, with three significant buildings erected in the last 20 years alone.
In modern cities, it is likely that the larger errors in temperature for WMO Class 4 and 5 stations occur at night due to the heat-retaining qualities of steel, concrete and glass buildings. Heat is absorbed during the day and released slowly through the night. As urbanisation has increased with population growth and development, then, we may ask whether the full impact of the change in land use has been captured in climate assessments. Spencer, Christy and Braswell have recently produced a paper on this question related to changes in population density which indicates a significant amount of warming is due to the effects of urban heat.
So, there are a number of questions for climatologists to answer. How has the move to PRTs and data-loggers affected climatological returns? And secondly, how has urban development and the downgrading of the quality of observing sites as a result of urban encroachment affected how climate extremes are measured, particularly in the last 30 years? These are factors that have become more pressing since the 1990s as land-based observations have increased in importance. It is noteworthy that climatologists have worked hard to adjust temperature records from the 19th century, for example in the HadCRUT5 dataset, which, following the retrospective adjustments over a century after the fact, showed more warming than earlier versions of the HasCRUT dataset. The Met Office reported in 2020 that, as well as increased use of land-based observations in the new dataset, it utilises “statistical methods to extend the dataset’s coverage in the early record and in areas that are still data-sparse today, such as the rapidly warming Arctic”. Such statistical methods in the data set are of course somewhat subjective and imperfect. It is also relevant to note that as land-based observations have become more important in the dataset, the quality of such observations has decreased with possibly larger sources of error from long-wave radiation.
Greater care and attention now ought to be given to the more quantifiable effect of recent changes in temperature recording equipment and the growth in the built environment. The suspicion is, of course, that changes in both may have led to higher temperatures in the dataset since the 1990s, over and above any actual climatic temperature increase.
Andrew Sibley is a semi-retired Chartered Meteorologist with an MSc in Environmental Decision-Making and an MPhil in Theology.
To join in with the discussion please make a donation to The Daily Sceptic.
Profanity and abuse will be removed and may lead to a permanent ban.
Sorry, but a flippant question about your qualifications. Was it the Theology of Meteorology?
In truth, I suspect you are better qualified than most climate commentators and thank you for highlighting this fact about thermal inertia. It doesn’t seem to figure in the alarmist reports of transient spikes on which so many claimed records are based.
The theology of weather prophecy – I hear a prayer improves the forecast.
So… the Met Office has adopted a measurement system that generates more noisy data?
The better to make a lot of noise about.
The more they try to manipulate the data and deceive the public the more sceptical we all become. We doubt the competence and motives of politicians and civil servants and technical people alike.
Why are they surprised.
Who could doubt the Australian cartoonist who originated the 97% of scientists fairytale
It’s even more basic than this. Measuring things outside of laboratory conditions is inevitably fraught with problems. Take for example the simple fact that the density – and not only the frequency – of measure has also changed massively over time, too. Meaning, the number of stations has fluctuated hugely since the UK first started measuring this stuff.
I wrote a silly little piece twelve years ago, using a very basic dataset of when each station was opened and closed.
https://public-highway.blogspot.com/2013/01/rainmasterall-since-records-began.html
Recorded hours of sunshine have increased markedly over the past 100 years.
I guess some of this is down to lower levels of particulates in the atmosphere as we’ve stopped burning coal & things like the Clean Air Act.
It would be interesting to hear what impact this has had & how much sunshine has been a push rather than a pull factor in temperature changes.
Plants love sunlight
‘the primary purpose being to reduce costs …’
Doesn’t it have a budget of £300 Million?
They easily burn through that with the costs of a CEO, final salary pensions, DEI officers and PR departments. Hardly anything left for super computers and still less for accurate data collection.
I thought us taxpayers shelled out for TWO supercomputers in the last decade or so to help them get bullshit faster.
I see the Met Office has fully embraced trans orthodoxy today. Hurricane Humberto has crossed the Atlantic and now identifies as Storm Amy 😂😂😂😂
Are all these instruments calibrated against a single reference instrument? No?
So the global temperature record is a meaningless jumble of numbers.
Impossible to measure, much like sea levels.
Especially when you see how much of the globe has no weatherstations.
Indeed. The earth, surprise surprise, cannot be measured as if it were in a laboratory.
The suspicion is, of course, that changes in both may have led to higher temperatures in the dataset since the 1990s, over and above any actual climatic temperature increase.
Further suspicion is that this feeds into the climate narrative perfectly, and that there is absolutely no intention of correcting or amending any such readings and records.
Funny how all data correction makes global warming appear worse…
I’m a member of the public, I have known about this for decades.
The author seems to know meteorology and its instrumentation, but is strangely ignorant of the data analysis methods used to deal with non-climatic influences on temperature trends.
Firstly, when PRT thermometers were adopted as the standard, there were around 50 stations in which overlapping measurements were made. They wrote an internal document that said that the switch from liquid to PRT had little impact. Anyone can check this, as all measurements are available to the public via MIDAS-OPEN. I have looked at a few examples, but gave up when nothing big was found.
Secondly, sudden shifts in temperature are readily detectable via comparison with neighbours, the UK in recent decades has a very dense network of stations, hence many neighbours, jumps as low as 0.1C can be easily seen. There are no such jumps AFAIK.
Thirdly, attempts have been made to correct for urban heating in the one “composite” product that the Met Office deals with: the Central England Temperature series. They have got this wrong, there was no significant urban heating when they assumed it must be there, hence they have distorted the trends by correcting for something that does not exist.
If you have a link to this internal document I would be interested in reading it. We can then assess how the instruments were compared. The link to Jennifer Marohasy’s blog suggested that BoM were happy with an error of +/- 0.5C, but little further info. I’m sure the climate datasets allow for the UHI effect, but have they kept up with development in the last 30 years, and take into account the downgrading of observation classification?
I believe one of the leading climate crooks Phil Jones allowed half a degree for UHI. I have seen FIVE degrees change driving in and out of the South London suburbs and more surprising to the surrounds of Gatwick Airport.
“…there was no significant urban heating…”
Nonsense. Even the most casual observer recognises urban heat.
Are you, in fact, a bot, Climan?
So have written twice to the met office asking for clarification regarding Chem trails. On both occasions, the met office explained via three pages of nonsense that we do not have Chem trails, they are con trails. And yet recently the U.K. hiv’t admitted we do have Chem trails intentionally manipulating weather. Was the net office gagged? If do, why?