Sensational New Measurements of Uncorrupted Air Temperatures Destroy UK Met Office Constant Claims of ‘Records’
Further dramatic scientific evidence has emerged to show that the UK Met Office’s 387-strong temperature network is hopelessly corrupted by unnatural heat influences and is effectively useless in providing credible guidance on many individual measurements and average trends. Since the Met Office has so few stations in pristine, uncorrupted CIMO Class 1 and 2 locations, where no errors are likely, nationwide ambient air temperature averages are impossible to gather, but Dr Eric Huxter has done the next best thing. He has examined over half a million 60-second measurements over the year at the Class 1 site at Rothamsted and produced a benchmark database against which the obviously unnatural ‘heat spikes’ that litter junk Class 4 and 5 sites can be compared. His results are truly shocking. One set of junk sites declaring daily spiked maximums since late April are on average well over 2°C higher than that expected at Rothamsted.
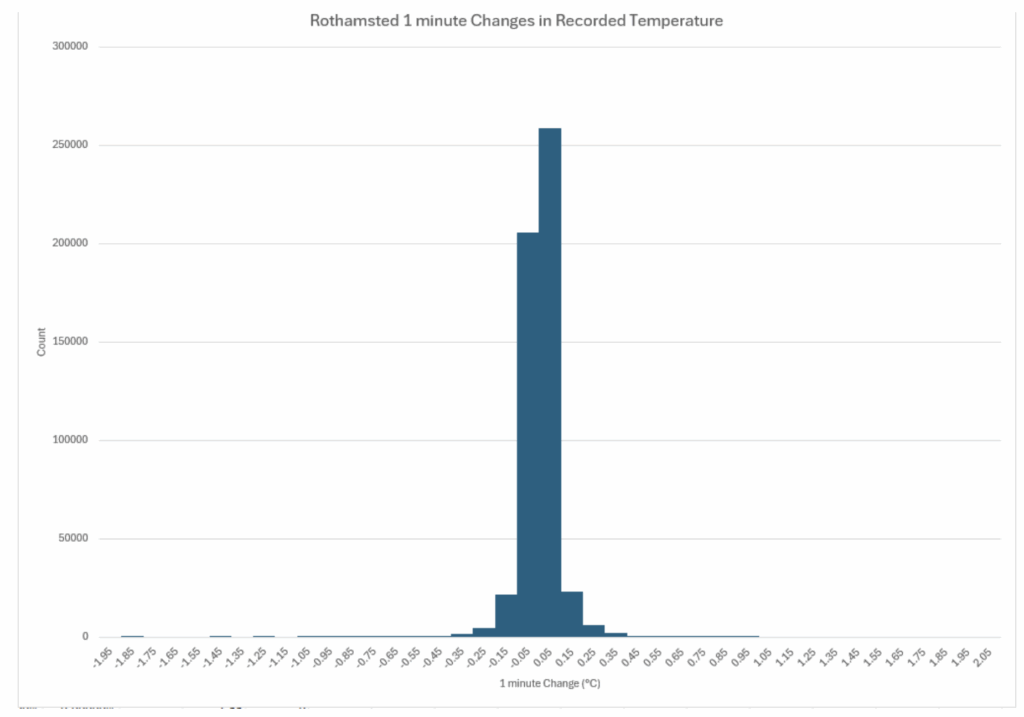
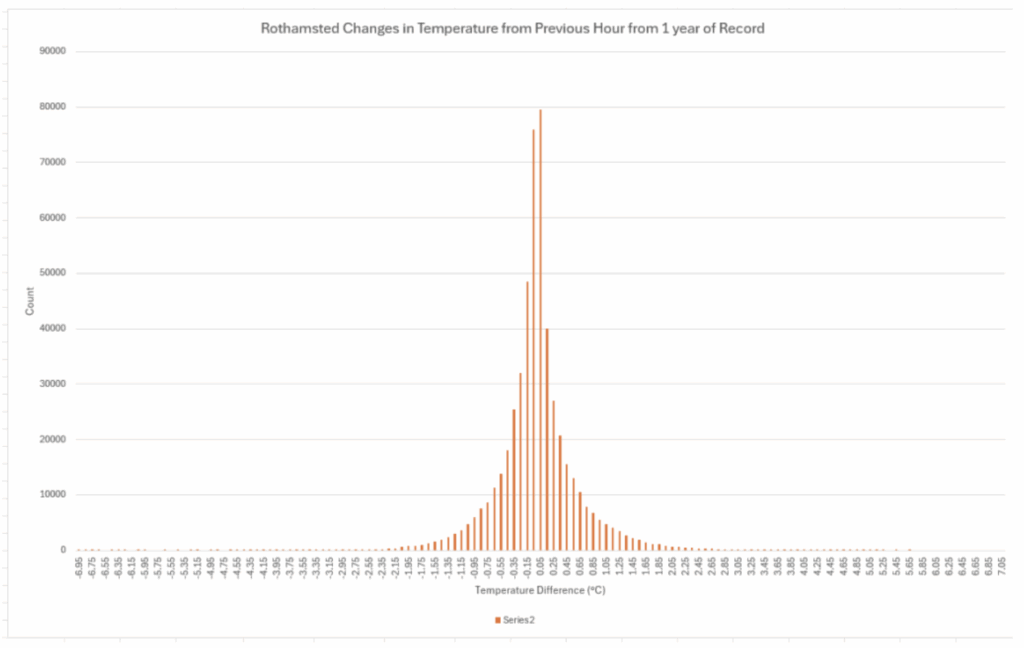
The main takeaway from this new crucial scientific evidence is that many daily maximum temperature spikes at Met Office stations are not genuine weather events but artefacts arising from careless, bad or even intentionally poor siting. At Rothamsted, changes from minute to minute follow a predictable natural pattern, with the vast majority of the 525,541 readings varying from -0.15°C to 0.25°C. Individual changes from the previous hour show an expected wider spread and, depending on the season, vary over the majority of the readings from around -0.35°C to 0.45°C. To give an idea of how dreadful some of Met Office data is, consider its declaration that the hottest ever UK May 1st temperature of 29.3°C was recorded this year in the urban heat jungle of Kew Gardens. The measurement occurred at 2.59pm and was no less than 2.6°C higher than at 2pm and 0.76°C above the 3pm mark – whatever was being recorded on that day, it is highly unlikely that it was the ambient natural air temperature.
At Class 1 pristine sites like Rothamsted, set in open farmland, we are indebted to Dr Huxter for revealing how natural temperatures behave. First, he shows in the graph below how they change from minute to minute.
The second illustration shows the change from the previous hour.
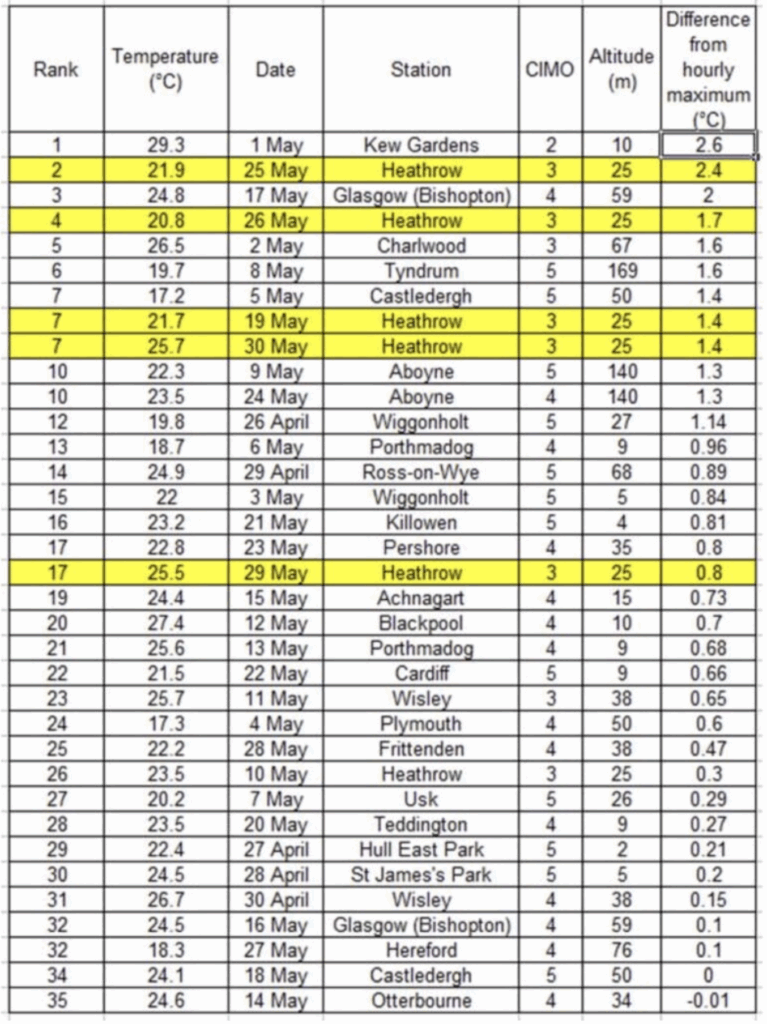
These two graphs show the variation of natural air temperature when it is measured properly under credible scientific conditions. The following table from earlier Huxter’s work shows how large the distortions can be when Met Office daily maximums, or ‘extremes’ as they are categorised, are drawn from badly sited stations. Listed below are 35 daily highs starting on April 26th this year and the difference from the recording at the hour. All but one of the recordings arise from CIMO Classes 3, 4 and 5, with internationally recognised ‘uncertainties’ up to 1°C, 2°C and 5°C respectively. The overall average ‘spike’ is 0.89°C, which is far higher than the overall average at Rothamsted.
It gets worse. Dr Huxter kept his daily maximum recordings going throughout the summer and, from 126 days of data, was able to draw further mathematical conclusions. He found that spikes at 67% of these daily recordings had only a 1 in 6 chance of occurring at a Class 1 site. The 126 recordings occurred at 45 different locations, of which only 13.3% theoretically had no additional error due to Class 1 and 2 siting. The average across the remainder was an astonishing 2.8°C, which Huxter notes “is not acknowledged by the Met Office’s public face”. Why should it, it might be asked. The Met Office is full of Net Zero activists, and they have weaponised temperature observations to scare the public witless and promote the fantasy that the world can get along fine without using hydrocarbons. Daily average temperatures are calculated using only the maximum and minimum recordings, and these provide a plentiful supply of ‘hottest evahs’ across days, months, seasons and years. After that, the figures are combined with similarly corrupted data from around the world to produce an inflated global warming figure.
And even worse still, Huxter notes that a contribution to the heat spikes is the use of new, highly accurate, electronic Platinum Resistance Thermometers (PRTs) in unaspirated Stevenson Screens. Two thirds of the 126 recordings were produced at stations with wind data, and it was found that these received only 28.3% of the minimum expected for such a device in the Stevenson housing. “Given the sunny dry summer, these PRTs are baking, producing data that does not represent a ‘true’ meteorological signal,” he suggests.
The Met Office does not seem to agree, or even care. It declared this year’s summer in the UK was the ‘hottest evah’, pushing the glorious 1976 experience, measured by the old mercury-in-bulb instrument, down to a lowly sixth place. Meanwhile, a recent Freedom of Information request revealed that over the last 18 months it has increased the percentage of 4/5 junk sites in its nationwide network from 77.9% to a frankly ludicrous 80.1%. Seemingly not content with that, it has added 11 new classified stations that have been deliberately placed in the 4/5 junk dump.
Huxter concludes that the Met Office is providing a “misleading picture” of UK maximum temperatures. Over the years, he argues, it has become the standard bearer for ‘weather fear’ based on its anthropogenic climate change belief system. ‘Feed the fear’ has become a common thread in its public communication. He also notes the “close links” with the BBC and like-minded media outlets, “to whom any apparent ‘record’ is immediately communicated with the simple subtext of ‘climate change’.”
The Met Office complained recently that a small number of people are undermining the integrity of its observations, “in an attempt to undermine decades of robust science around the world”. In fact, what has happened is that a UK Government science department, overrun by political activists, has weaponised the results of a temperature network and is using it in a way that was never intended. The existing higgledy-piggledy system cannot provide data with the precision required for the Net Zero political agenda. Activists often warn that every tenth of a degree centigrade counts, and meteorologists claiming to measure temperatures to within one hundredth of a degree give them crucial ammunition.
Although mainstream media has ignored the scandal around the network’s improper use, the Daily Sceptic is aware of growing concern in both houses of the UK Parliament. The biggest fear, and one shared by many within the Met Office, is that political controversy around its junk temperatures will detract from its many useful roles in measuring local conditions from walled gardens to airport runways, and providing vital forecasts and warnings of forthcoming bad weather.
Chris Morrison is the Daily Sceptic’s Environment Editor. Follow him on X.
To join in with the discussion please make a donation to The Daily Sceptic.
Profanity and abuse will be removed and may lead to a permanent ban.
Thanks for staying on top of this. Just more ‘The Science’ corruption, fraud, mendacity. Follow the money to find the fraud.
No wonder no one trusts Government or its ‘agencies’. Frauds, charlatans, criminals.
I am sure this Sept – an ugly month – will be the hottest Sept evah in 4 billion trillion brazilian darwinian years.
This is all good stuff. But too dense and too complicated to be communicated, understood and digested widely.
We need the equivalent of the infamous hockey stick graph (for its simplicity and clarity, not for its mendacity) to create that Eureka moment where the public suddenly gets it.
I don’t know what that looks like, but we need it.
Something like page 3 of “The Sun”, perhaps?
Not sure how a topless woman would help, but I suppose when brainstorming there are no bad ideas…
Perhaps if she has a PhD in meteorology?
Give her an hockey stick?
According to The Science™️, the Sun has no influence over climate.
Au contraire, I recall as an early-morning paper boy that many of those life-giving globes had a great influence over my climate.
Melinda Messenger has good statistics, was a television chat show host, and has qualifications in psychotherapy. Since climate alarmism is a collective shared neurosis or mass hysteria, she is brilliantly qualified and positioned to show the world that (as psychiatrist Bob Johnson describes it) “the box is empty”: that is, a fantasist’s fixation is not real.
soundofreason summarises it well below but you’d probably need something eve pithier – hard though as though the logical steps are not that hard, there are steps.
Maybe just two graphs with “normal temperature variation” and “variation from dodgy measurement”. After all, I think most people intuitively would say that the air temperature doesn’t usually suddenly go up and down.
We know that the Met Orifice are a Government run propaganda machine. I never use them.
The rainfall patterns they use for their GB News forecast never match reality as shown by netweather.tv live radar and animated previous radar snaps. Most of the forecasts are rubbish more than a couple of days out. If you had looked at Brands Hatch for this weekend you might have considered it not worth the trip with rain both days. Both days were great for motorcycle racing while ironically the BSB Championship struggled with rain in Drenthe, Netherlands.
So to summarize:
Temperature spikes happen rarely in Class 1 or 2 sites. The temperature varies smoothly from minute to minute and hour to hour. This derived from recorded data.
The fact that temperature spikes do occur at Class 3-5 sites indicates that the data is not measuring ‘natural’ phenomena.
Because they are not natural, spikes should not be included in calculations of the daily average from maximum and minimum recordings at each station. But they are and that makes them nonsense.
The temperature recordings at Class 3-5 sites are still useful for understanding local conditions – but not for understanding ‘climate change’.
Because they are not natural, spikes should not be included in calculations of the daily average from maximum and minimum recordings at each station.
Calculating an average from minimum and maximum is an artefact of obsolete temperature recording devices and guaranteed to give biased value because the maximum is going to a short-term spike for measurement devices in locations susceptible to these. A much better idea would be to use the daily median temperature which can be found by sorting all temperature recordings sampled at ‘suitable intervals’ and then picking the one in the middle of the sequence (or the average of the two middle value if the length of the sequence is even). A trimean might also be an idea (average of 2 times the median and the first and third quartile).
Totally agree. Median would give a better ‘average’. Taking the most frequent (mode) measurement between certain times might be quite informative too.
Spikes aren’t really important for climate measurements: almost the opposite. Climate is by definition “average” weather, not “extreme” weather. Spikes are of interest only to journalists wanting headlines and alarmists seeking to “alarm the populace”, and possibly civil emergency managers.
“Further dramatic scientific evidence…”
What on Earth does science and evidence have to do with the climate religion? Heretic! Get thee to a nunnery!
Look, I realise it’s 2025 and he can be anything he wants to be but… a nunnery?
That’s why there is now a trigger warning on Hamlet.
So not for the murders then?
What about mental health issues? White privilege?
It’s been about 50 years since I last read it or saw the play performed.
Pouring poison in people’s ears? Ah! He means schools!
Acherly what ol’ Shakespoke meant was a brothel. Now that could be very confusing for some people.
Just as with vax deaths, these inconvenient facts will be ignored.
Too many big salaries, livelihoods, egos, reputations and – most importantly – the cornerstone that props up the rotten establishment edifice, depends on corrupt data.
It should not be difficult to process the raw instantaneous PRT data to simulate the response of mercury thermometers so that they could eliminate the short term spikes, but of course this would rather destroy the hottest evah narrative of the MO.
There is also the issue of switching from max-min mercury thermometers to quasi-instantaneous electronic sensors. There is no engineering reason to suppose that the two systems would give the same answer over a twenty-four hour period. The arithmetic is a bit much to go in a comment. In outline, the problem is that if the diurnal cycle is not substantially symmetrical (equal high above mean to low below mean) then there will be discrepancies. In particular, if the cycle is very low minima overnight but modest peaks during the day, then a min-max will record lower than the instantaneous system. Thus switching from one to the other needs compensation otherwise there will be a bogus step change in “climate” figures.
Anthony Watts USA rural weather stations surfacestations.org shows l9ng term cooling in the USA.
Sick abuse of taxpayer money.
Any critical post on their blog ia always deleted without a response.
It’s no wonder their product is so inaccurate if they care so little about the accuracy of their data. But this is not about accurate forecasting, this is about political activism.
Bonuses all round at the Met Office.
While I share your scepticism about the Met Office numbers, max/min avg calc, Climage change, PRTs etc and follow Tallbloke’s Workshop for the detail of the MO idiocy and groupthink (not to mention possible corruption), I don’t think these graphs help you in the way you think.
The minute change graph shows that there can be +1 or -2 (approx) degrees of change and the hour graph that there can be +5 or -7.
They are very unlikely, but not impossible, so when you are talking about hundreds of stations and hundreds of readings at each, the unlikely happens quite often.
An interesting contrast to the excellent statistical analysis in the article on Covid.