Heatwave Hysteria Strikes Again
Spring in Britain (or at least the parts of it I have visited) was one of the best I can remember. Farmers have complained about it being a bit dry (in contrast to recent years being extremely wet), but for the rest of us, the warm but mild temperatures and fresh conditions were welcome. Early summer has also brought us some exceptionally nice weather. But towards the end of last week, the heatwave began to intensify. And rather than allowing us to bask in the glorious rays of a flaming June, the miserabilists were mobilised to pour misery on our delight. What we were enjoying, claimed these green grinches, were portents of doom. People were going to be killed by it. But this echo of Greta’s I-want-you-to-panic catechism lacks objective, scientific foundation.
The first and most ridiculous of this species of claim was that produced by the go-to outfit for every obedient climate journalist, the World Weather Attribution (WWA) group, largely based out of Imperial College (of dodgy Covid mortality projections fame, using very similar methods). ‘Deadly weekend heat in England “100 times more likely” due to climate crisis,’ proclaimed the Guardian’s Environment Editor Damian Carrington, following the WWA’s analysis. But ‘attribution’ of weather events to anthropogenic climate change is profoundly unsafe, and indeed, unscientific. It is a media stunt, intended to drive commentary, not reveal knowledge about weather.
‘Attribution’ owes very little to objectivity and fact. Rather than basing estimates of the influence of a warmer planet on observational evidence, researchers like those at the WWA instead compare the outputs of computer simulations with different starting points for atmospheric CO2 concentrations. The “100 times more likely” claim emerges from the comparison of the outputs produced by the two simulations. This is unscientific, because simulations are not the real world; the simulations include all of the assumptions that ideologically-motivated researchers programme into them. Ideology in, ideology out. Actual science requires a comparison of a hypothesis’s claims against evidence obtained by observational evidence – experiment. WWA is consequently little more than a machine for producing BBC and Guardian propaganda articles.
A similar enterprise has been developed by researchers at the London School of Hygiene and Tropical Medicine (LSHTM). On Saturday, LSHTM published a press release, widely cited by the fake news media that claimed: ‘Nearly 600 heat-related deaths expected in UK heatwave, researchers estimate.’ According to the statement, “Real-time rapid analysis reveals impact of rising UK temperatures.” But that’s false, in any event. There have always been heatwaves. And as I pointed out last year on the Daily Sceptic, not only do the summer months bring lower rates of death, the historical trend shows that so-called ‘excess summer deaths’ (the number of deaths above the average for that week of the year) have fallen dramatically over the last century.
In the 1911 heatwave, for example 3,228 people died in London alone. The impacts of weather, climate and heatwaves are diminishing, no matter whether or not the underlying meteorological data exhibit any change, and whether or not any part of that change can be attributed to any cause. LSHTM has decided, for no good reasons, to abuse its status as a research centre, to provide a morbid, ahistorical and unscientific commentary in support of political narratives.
The need and desire for such data to convince the public that their interests lie in radical and expensive emissions-reduction policies and in green politics more broadly, has created a market for climate chancers of all kinds. But the task of producing an official version of the relationship between heatwaves and deaths falls to the UK Health Security Agency (UKHSA). Though this fails to provide running commentary of the number of deaths per day, thereby failing to keep people terrified of sunshine, it does attempt to compile retrospective statistics of the kind that we became used to during the Covid debacle.
According to the HSA’s ‘Heat mortality monitoring report, England: 2024‘, last year four main heatwave events claimed the lives of 428 people aged 75 to 84, and 753 people aged 85 or over. That may sound like a lot, but here’s what it looks like, when seen in the context of total numbers of daily deaths.
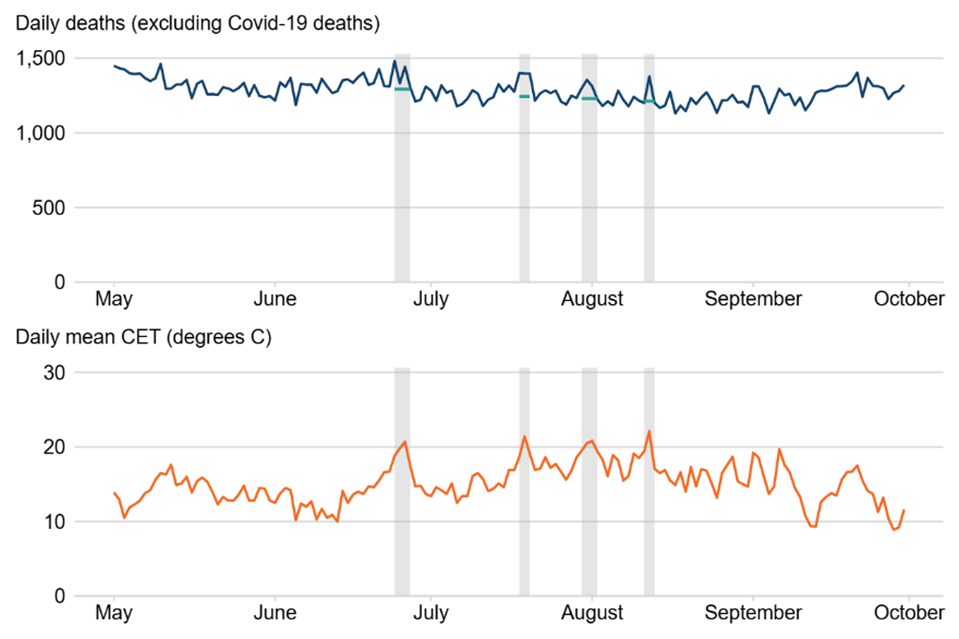
It does appear that heatwaves drive a small increase in daily deaths. But it also seems clear that although temperatures increase into the summer months, heatwaves of the same (or greater) magnitude do not have an increasing effect. The UKHSA estimate of heatwave-related mortality might therefore better be explained by data-torturing than by real-world effects. So who is really being killed by heatwaves, and what else might explain these deaths? And what are these deaths, in reality?
According to the UKHSA’s data, 4,087 life years were lost from the 75-84 cohort, and 2,844 life years lost from the 85-plus age group. These would indeed seem to be tragedies, amounting to premature deaths of 9.6 years each in the younger group, and 3.8 years in the older. These are significant lengths of time that cannot be ruled out callously. If they are correct, these statistics represent time spent in enjoyment at the end of long lives, with families, grandchildren and new great grandchildren. Life is worth living, despite MPs’ claims to the contrary.
But there are very strong indications that deaths attributed to heatwaves from these cohorts are not from individuals that have these futures. The HSA’s data is not sufficient to examine the detail for either group, but it is clear enough to establish that 496 of those deaths occurred in care homes and 473 in hospitals. Just 358 died in their own homes. And they died with significant comorbidities. Some 440 (37%) had circulatory diseases, 201 (17%) had cancer, 78 (7%) had chronic respiratory diseases, 229 (19%) had dementia or Alzheimer’s, 79 (7%) had influenza or pneumonia and 268 (23%) had a comorbidity described as ‘other’. Though any of those individuals may have had one or more of those comorbidities, it is clear that heatwaves are a mortality risk mainly to the very frail.
Heatwaves – whether or not the result of ‘anthropogenic global warming’ – are not striking down normal, healthy young people with decades of life in front of them. And indeed, objective commentary observes that a heatwave only brings forward deaths by a few days, right at the very end of life. Rapid responses are silly interventions offered by individuals and organisations that are taking on political roles, not seeking to inform public debate with objective fact and reasoning.
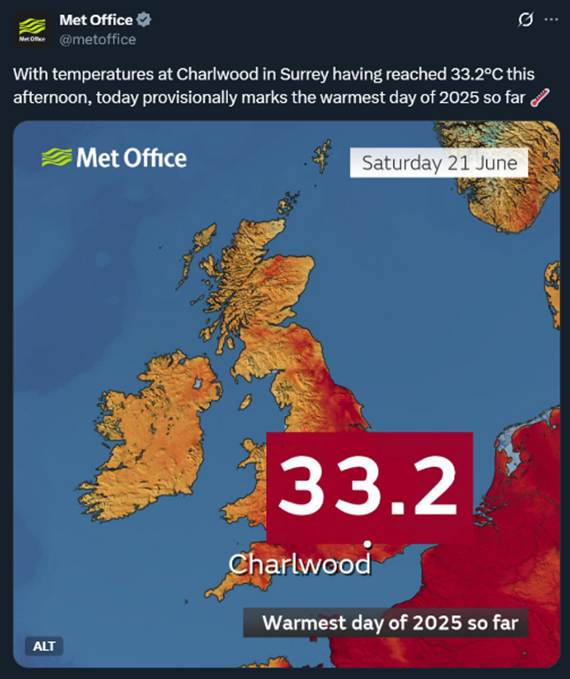
But what about the weather itself? What actually happened? As sure as eggs is eggs, it is the Met Office who will mislead the public with dodgy readings from thermometers at dubious locations. “With temperatures at Charlwood in Surrey having reached 33.2°C this afternoon, today provisionally marks the warmest day of 2025 so far,” tweeted the Met Office.
The problem with that is, as all who track these stories know well, these seemingly record-breaking thermometer readings come from weather stations sited at airports. Charlwood is no exception, being sat about a kilometre from Gatwick Airport’s runway. The Charlwood weather station is depicted below by a small red dot.
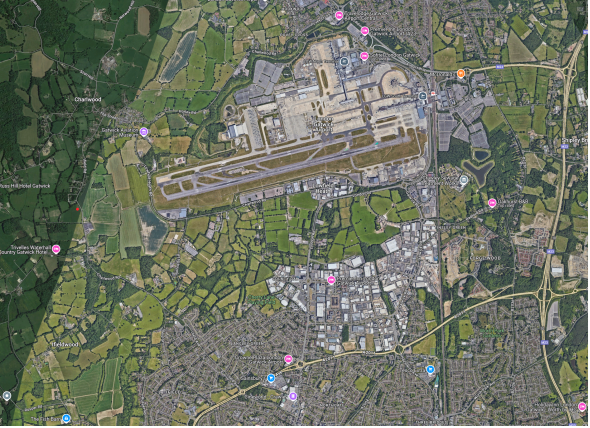
There are seven square miles of tarmac and concrete directly to the east of the Charlwood weather station. These substances absorb energy from the sun and re-emit heat far more readily than air, such that when air temperatures are in the order of 30°C, the runways, hardstanding and buildings will be in the order of 50°C. And these in turn heat the air. Moreover, of course, Gatwick sees about a flight a minute either arriving or departing from its runway at busy times – hot jets blasting the air in all directions.
I pointed this out on X, to much green annoyance. I was stupid to suggest that jets could blast hot air an entire kilometre away, whinged the chorus. False. At take off, air being pushed out of jets reaches far, with 1,900 feet (579 metres) behind the engine being classified as a hazardous area. Air, from the jet itself, and rising from the hot runway tarmac, can be moved from the airport to nearly all the way to the weather station in the blink of an eye.
And it was ridiculous to claim that the ‘Urban Heat Island’ (UHI) effect of higher temperatures could influence the station, claimed the same whinges, because most of the distance between the runway and the weather station was ‘rural’ — pasture. But this too is false. Warm air is not like some kind of vampire, unable to cross the boundary of a home it is not invited into. True, rural landscape in general does help to dissipate heat. But this is not the case where conditions are very dry (as they were) and sparse grassland.
Moreover, UHI effects can travel very far distances indeed. A 2018 study of UHI published in in the journal of Climate and Atmospheric Science found “significant heating 100-200 m above the surface and 70 km downwind” of Chicago. A 2017 study in Britain, although concerned more with night-time temperatures, found that even a relatively small site of just 1 km square could influence temperatures half a kilometre away by 0.5°C.
To add to the problems of the weather stations categorisation of ‘rural’, to the southeast of Charlwood is the sprawling city of Crawley. And here, the population has increased by 11% since 2011, to 118, 500 people. Growing populations, increasingly busy airports and more powerful jet engine designs: it might be the case that the Met Office’s thermometers are better at measuring development than temperature.
It’s not wholly accidental, nor even deliberate, that the weather stations the Met Office uses to underscore its climate change narrative are frequently located at airports. There are weather stations at all airports in order to assist pilots’ navigation, and the Met Office was charged with producing reports for aviators for good reasons in more sober and enlightened times – when flying was seen as a Good Thing. But ideological mission creep now seems to have made enemies of aviation and its service personnel.
So it is of course far more likely for a weather station to be at an airport than somewhere else. But it is also far more likely for a weather station near an airport to be warmer than anywhere else, because of that airport’s construction – especially in a heatwave. And it is more likely that the area surrounding an airport will have seen rapid and extensive development that further adds to its UHI effect. This makes using temperature data from these sites for any other reason than aviation all the more problematic. They may not be suitable as weather monitors at all, and, given the nature of development, they may be even less useful as instruments to measure the effect of climate change. Failing to acknowledge it is like the ‘climate scientist’ noticing, but doing nothing about, his colleague’s thumb on the scales.
To join in with the discussion please make a donation to The Daily Sceptic.
Profanity and abuse will be removed and may lead to a permanent ban.
The Establishment want the predictability and comfort of rules around them (rules for little people, naturally).
So anything that threatens the predictability and rules is a “Bad Thing” and is used as a means of threatening the general population. The threats may be completely fabricated, but never mind.
So the weather may be too wet, too dry, too hot, too cold – no matter what actually happens. Similarly Brexit was alleged to ‘make the sky fall’, the economy is (always) running too hot, or in recession. COVID was going to kill 500,000 people. Populism is a terrible threat to society, and there is no such thing as too much diversity.
The Establishment want to Make Britain Grey Again. They have got away with it for decades – I choose not to go along with their fantasies.
We all know that given the past week’s temps and the coming high temps into July, that June & July 2025 will be the hottest evah! in 4 Trillion billion brazilian darwinian years. Yawn. If one searches hard enough you can probably locate 20-30 Junes since 1880 when temp measurement began, with higher temps, esp if you account for UHI and the current data fraud. UHI by itself can add 3-7C to a temp reading vs a truly rural site.
People should be challenged to show their workings when making claims like “100 times more likely”, but such calculations would of course go straight over the heads of your average Graun reader.
People making such claims should immediatley be told to shut up. A probability is the likeliness that a random selection experiment will have a certain outcome, expressed as relative frequency of the outcome in in question. This is the number of times a certain outcome is expected to occur divided by the number of all outcomes.
Relative frequencies can be calcluated for a lot of other things as well but if there’s no random selection involved, they’re not probabilities.
100% it would.
Guardian readers erupted into a huge whiny comments section after a post Brexit article, about buying online becoming too expensive from Europe. It turned out they were paying VAT twice.
Temperature measurement stations close to airports realistically measure the temperature there and insofar human settlements are also close to them, as is usually the case, the also realistically measure the temperature the people living there will experience. The problem comes with attribution: For the purpose of climate change policies, it’s claimed that the overwhelmingly important effect on the temperatures there is the amount of CO₂ in the atmosphere next to a vulcano in Hawai and this, in turn, is claimed to be caused by human activities in so-called developed countries regardless of the actual CO₂ emissions caused by them.
There is a very interesting news story from Northern Ireland this week, highlighting the madness of Net Zero.
The A5 statistically is the most dangerous road in Northern Ireland but Net Zero policy is preventing it from being upgraded, despite the fact that it is costing lives:
https://www.bbc.co.uk/news/articles/c79qd843yqeo
“The High Court judgement blocking the upgrade of the A5 road shows the reach and impact of Stormont’s climate change legislation.”
“In his judgement Mr Justice McAlinden ruled that the Department for Infrastructure was in breach of Section 52 as it had failed to produce the evidence to show that upgrading the A5 would be consistent with overall climate targets.”
Feelings don’t care about your facts Ben!
“Daily deaths (excluding covid-19 deaths)”.
I didn’t realise this nonsense notion of a “covid 19 death” was still something being kept track of. I cannot fathom why anyone would now make a special case of “covid 19 deaths” or keep a total of all deaths “Not from covid”. People die of/with all sorts of stuff. Baffling.
Charlwood is a bullshit site that has been shown up as giving fake temperatures in the past. When it comes to UHI around Gatwick I can attest to it being worth 4 degrees. I drove 8 miles from my house in the countryside one cold night to go to a place on the edge of the airport. I got back in the car and was surprised to see it showing 3C when it was freezing at home. Driving back I watched the thermometer slowly dropping down to be -1C at my house. On the day of the great fake hottest evah at RAF Coningsby, Charlwood was claiming 40C just after 11am. I recorded the temperature that day and just scraped over 38C and that was not until 2pm. I looked at the Coningsby record and there the peak period – excluding the landing Typhoons – was from 2pm as well.
The other day, in an interview with a BBC presenter, a Network Rail guy said that the ground temperature on the track could easily be up in the 40s °C in that afternoon, i.e. well above the air temperature. That’s true even with farm fields on both sides. So yes, the local positioning of the instruments makes a big difference.
My local little online newspaper has a forum and the usual suspects are baying on that because we are having summer weather, its a sign of impending doom.
Reading today so far is overcast and showers. If there’s doom impending in your place, it must be a very localized phenomenon.
🙂
I live in the mid-atlantic, USA and we have had 3 days of temps over 100F.
I remember from childhood, learned from my Victorian grandparents…
January – North wind doth blow and we shall have snow.
February fill-dyke (frost and snow start to melt filling the water courses in the hedge backs)
March comes in like a lion, out like a lamb (the change from Winter to Spring, cold winds, turning to milder weather.)
April showers – self explanatory.
Never cast a clout til May’s out (Weather variable… can be deceptively warm and sunny one day but quickly turn cold and wet the next.)
Flaming June – where we are today, known for its hot sunny days and the start of Summer.
Weather is not a recent invention. June is “flaming “ today just as it was for previous generations. Nothing new under the Sun.
Do not leave the house. It is dangerous outside. Just in case you forgot even making a bed can give you a heart attack. Don’t think too much you will get all hot and bothered. Keep your mouth shut. STAY HOME SAVE LIVES. I will say to be fair that exposure to sunlight feels very different than it used to. The wavelengths coming in have shifted and in a very unhealthy way. If you go out even when the temperature isn’t particularly high you will feel a burning just under your skin that wasn’t present with the same sunlight levels before.
Sunlight infused withh napalm and sulphuric acid you dig. That is what they tell you. They don’t create the darkness they are subject to it themselves. And they are weak when things get really dark. I would say go out in the sun but understand that prolonged exposure will lead to nasty little beings attacking you. This is a time when the true light is prone to malfunction.
Anybody who thinks that 30c or thereabouts is a ‘heatwave’ needs to spend a bit more time in warm countries. In a lot of places that is a pleasant summer day.
Regarding the weather conditions at Gatwick on the 21st June 2025 and the ‘record-breaking’ heat measured at Charlwood in Surrey.
According to archived records on Meteoblue, on that day a light Easterly wind, around 10mph, predominated at ground level at the airport.
https://www.meteoblue.com/en/weather/historyclimate/weatherarchive/gatwick-airport_united-kingdom_6296598
Irrespective of any jet thrust effects and aircraft movement, the gradient wind would have anyway pushed vast amounts of heat from the airport tarmac and concrete structures in a westerly direction towards the recording station, likely making it appear hotter there than in reality.
I can’t help noticing that not only is that weather station close to the Gatwick runway – it’s directly under the flightpath.
https://reigate.uk/gatwick-flight-path-set-for-change/
So the planes taking off will be something of the order of 100 metres above the weather station.
according to the numbers you cite, 110% of people who died had co-morbidities! evidence of more data mangling?
The explanation which suggests itself would be people with more than one comorbidity.
There are other errors, though. It’s claimed that
four main heatwave events claimed the lives of 428 people aged 75 to 84, and 753 people aged 85 or over
This makes a total of 1181 deaths. But
496 of those deaths occurred in care homes and 473 in hospitals. Just 358 died in their own homes.
Total 1327.
The mistake is a typo – should have said: “496 of DEATHS FROM ALL AGES occurred in care homes and 473 in hospitals. Just 358 died in their own homes.” Total mortality for all age ranges. Age 0-24: 22 deaths Age 25-44: -13 deaths Age 45-64: 63 deaths Age 65-74: 58 deaths Age 75-84: 428 deaths Age 85+: 753 deaths Total: 1,311 That’s still short of the 1,327 you calculated. But the data isn’t coherent. Notice the negative deaths for the 25-44 category. That means there were 13 fewer deaths of people of those ages in the 4 heatwave episodes for that year. If you add up the actual deaths in each episode, rather than add the sums from the deviations for the year, you get 2,030 deaths. I omitted the under 75 categories, because they amount to extremely small numbers when you turn them into into deaths per day, and are just noise. E.g. the 63 deaths in the 45-64 group means 4.5 deaths per day, compared to nearly 54 for the 85+ and 30.5 for the 75-84. I wanted to do a deeper dive into these stats, but ONS really do not want anyone to. The datasets are… Read more »
Cold kills 10 times more people than heat, but in winter we never hear all the scaremongering cold stories that we always get in the summer regarding heat.—-But global warming theory states that it will cause it to be a little warmer at night and in winter. It does not state we will get more heatwaves. —–This is media scare story news. Ofcourse government and Green Activists approve of this misinformation as it helps keep the phony climate agenda in the publics mind.
Looks like another summer of sun dimming as on white skies. No real clouds just the chem trails above the layer of white. Florida just banned spraying of chem trails over the state.the same chem trails that everyone says don’t exist. Geoengineering is rampant. Pay attention folks. Snow in Montana a few weeks ago, record breaking heat in Midwest and east coast. Freak storms, hail the size of baseballs. If you think all of these events are “natural”. Listen to anything astrophysicist Professor Willie Soon has to say about the climate. Do your homework.
It would be great if Farmers or people not surrounded by concrete, could crowd source weather data going forward. Wouldn’t cost a lot today with wifi devices or even diy kits.