Ed Miliband’s Department Claims 30-Year Average Temperature is Higher Than the Warmest Year on Record
If you think the U.K. Met Office is adept at producing junk temperature measurements and statistics, just wait till you see what the Department of Net Zero and Energy Security (DNZES) is up to. Its compilation of 30-year temperature averages for its Energy Trends publication is so flawed, it might be easier and more cost-effective just to make the figures up.
The DNZES figures, both monthly and annual, are said to provide average temperature, “heating degree-days” and deviation from long-term measurements. Just 17 Met Office stations are used although, curiously, 21 sets of information arise due to site double counting. Eight of the stations consulted are in Class 4 sites with internationally-recognised ‘uncertainties’ of 2°C, while four are in Class 5 with possible errors up to 5°C. The data are not only corrupted by unnatural influences but also slewed by less than obvious geographical sitings. No measurements are taken in Northern Ireland, most of Scotland or mid and north Wales. The entire south-east of England is represented by Heathrow Airport, one of the worst places possible to gain an idea of surrounding air temperature.
The siting and identification of the relevant Met Office stations is shown below.
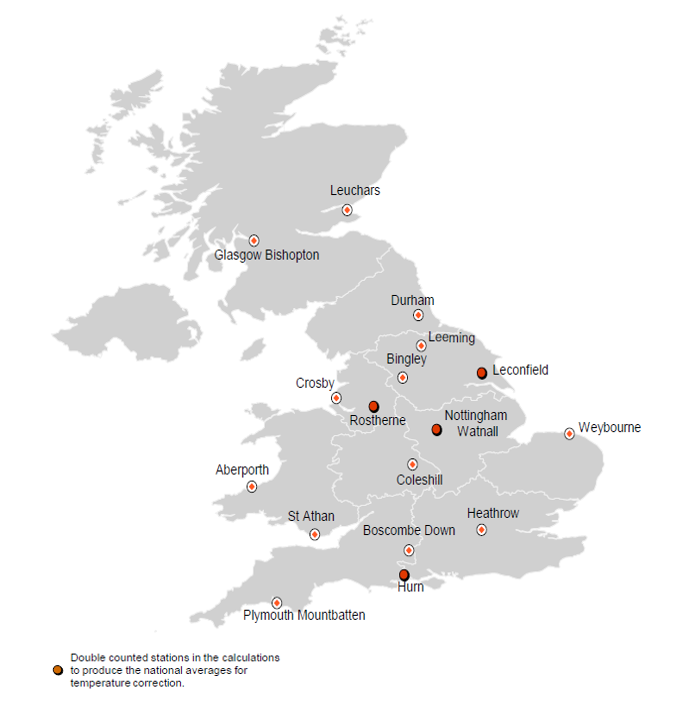
The eight Class 4 sites are Glasgow Bishopton, Bingley, Crosby, Nottingham Watnall, Coleshill, Aberporth, Hurn and Plymouth Mountbatten while the four Class 5 are Leuchars, Durham, St. Athan and Boscombe Down. Quite why four of the 17 sites are double counted “to produce the national averages for temperature correction” is not immediately clear. Admittedly the Met Office does not have many Class 1 and 2 sites, but quite why these cannot be used rather than the hopelessly corrupted bunch identified is again not immediately clear. But it gets worse.
Hat tip again to Ray Sanders, the citizen journalist who is carrying out a forensic examination of the entire Met Office temperature gathering operation. Noting that the DNZES statistics stretch back to 1980, he observes that doubled-up Rostherne was only opened in 2012. Glasgow is also short of a few years having started in 1998, as is Coleshill (1997), St. Athan (1997), Leconfield (2002) and Weybourne (1991). Just two Class 1 sites are used, neither of which existed in 1981. “This concoction of historic averages is reminiscent of Dungeness where stations that do not exist are attributed averages by what are no better than mathematical conjuring tricks,” Sanders states. The Dungeness note refers to the recent discovery that the Met Office has been inventing temperature averages for over 100 stations, a practice, and a subsequent attempted cover up, the Daily Sceptic recently reported here and here.
Sanders also casts a critical eye on the Leconfield site. This is a Class 3 station with uncertainties of 1°C but its doubled-up data arises from a location with “multiple issues”. In Sanders’s view, the site should be at least Class 4 due to nearby roads and tarmac. There is also the “serious issue” of a newly-built solar farm with 4,248 heat-producing panels standing just 80 metres (at its closest point) from the measuring device. “There are even bigger problems with the way in which its temperature readings are subsequently manipulated by Government departments that is almost unbelievable,” he adds.
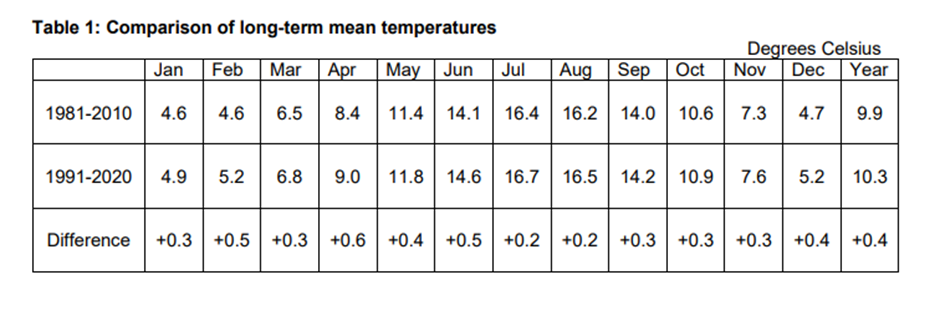
The end result of all these shenanigans can be seen in the table below. The average temperature for the period 1991-2020 was said to be 10.3°C, a figure that according to the Met Office has never been reached in a single year. The highest recorded temperature was 10.03°C in 2023.
It’s becoming clearer by the day that the Met Office’s temperature measuring operation is amateurish and unsuitable for the serious scientific purpose of underpinning the Net Zero agenda. Little care seems to have been taken over the siting of measuring devices, with nearly eight out of 10 stations based in junk classes 4 and 5 with huge uncertainties identified by the World Meteorological Organisation. Alarmists frequently talk about the dangers of warming of as little as one tenth of a degree centigrade but Met Office figures (and those of other state-funded meteorological organisations around the world, which suffer from similar problems) are incapable of providing measurements to this degree of accuracy.
Meanwhile, DNZES is in the hands of an extremist gang of weird political wonks led by the Mad Miliband. They are unlikely to lose much sleep over a few inaccurate temperature details when there is work to be done saving the planet. Dodgy temperature figures, hockey sticks and purple weather maps have been creating mass climate psychosis for years – the job is almost done. Now is time to make a real move on the hated free enterprise industrial society and the plebs who seem to take an unnatural enjoyment in the improved living standards it offers. Step forward Miliband’s right-hand man and the former Chief Executive of the Climate Change Committee, Chris Stark. Commenting on the Net Zero imperative, he recently said: “We are likely to see a move towards a more stick-like intervention into the future if we are not able to act.”
Things are getting hot – these people are ready to strike.
Chris Morrison is the Daily Sceptic’s Environment Editor.
To join in with the discussion please make a donation to The Daily Sceptic.
Profanity and abuse will be removed and may lead to a permanent ban.
Thanks Chris, another great article.
Quite so. Definitely needs a ‘stick-like intervention’. Our agricultural ancestors had just the right version of stick kept handy for remonstrating with such dangerous delusionals – topped with a couple of tastefully curved prongs.
Maybe pitchforks.
My stick has a walnut stock and optical sights.
Ah the direct approach as preferred by Luigi Mangione when commenting on the state of the American Health Care System.
Or a guillotine
It really is time to put this nonsense out of its misery.
Ideally I’d like to see prosecutions, huge fines and jail time for the orchestrators, but fat chance of that.
Just Stop.
Actually today Miliband is announcing more plans, more expense and more clutter to do Net Zero y 2030—–An impossible task at astronomical cost that will in the end impoverish us all and do NOTHING for the climate. —–Yet Net Zero is the law of the land. It was waved through Parliament in 2019 with no debate of cost/benefit, and no vote. This is pure insanity.
I inadvertently overheard part of a delusional conversation on the internet, today, about this: you wouldn’t have thought one participant was a minister of the crown.
There again, in these times, this government, you probably would.
I thought I would create a chart projecting CO2 out to 2100 and having increased to 1,000 ppm. On the left is how it’s usually shown and on the right is how it should be shown in context, against a scale of 1,000,000. Even when CO2 increases to 1,000 ppm the red line doesn’t budge. CO2 is most definitely a trace gas and it is difficult to see how on Earth it can be the temperature control knob.
It was once over 7000 ppm and the Dinasoars were forever moaning how long it took to cook an egg on their 4* 4 bonnets.
Then there is this: https://news.ycombinator.com/item?id=19863319 May 8, 2019 | Is Conference Room Air Making Us Dumber? If it is, it’s not due to CO2. The US Navy’s submarines are run with CO2 levels varying from 300-11,300ppm.[1] The military did plenty of studies in the 60s and 70s and failed to find significant cognitive effects in environments as high as 4% CO2.[2] > Thus, CO2 at 40,000 ppm for 2 weeks did not affect performance on multiple tests of cognitive function in physically fit young airmen, a population probably not unlike submariners. > A number of studies suggest that CO2 exposures in the range of 15,000-40,000 ppm do not impair neurobehavioral performance. Schaefer (1961) reported that 23 crewmen exposed to CO2 at 15,000 ppm for 42 days in a submarine showed no psychomotor testing effects but showed moderate increases in anxiety, apathy, uncooperativeness, desire to leave, and sexual desire. > In a 5-day exposure of seven subjects at a CO2 concentration of 30,000 ppm, Glatte et al. (1967) reported no effects on hand steadiness, vigilance, auditory monitoring, memory, or arithmetic and problem solving performance. > CO2 exposure did not affect performance on the tracking task or any of the six RPM… Read more »
This is at odds with current safety literature which predictably considers much lower limits acceptable even as low as 1,000 ppm. The subsequent conversations in the above cover this with the question as to why the previous military studies are ignored. It is evident that if we are being exhorted to be fearful of CO2 ‘breaching’ 400 ppm it doesn’t help the narrative if a 1960s US Navy Study found that Sailors can breath 40,000 ppm?
Ah but would we notice if they were drooling idiots already? I’m thinking mostly about certain government departments…
Great visual, thanks for sharing that
Undergraduate meteorology 101: It is likely that a nearby solar farm has negligible impact on the maximum and minimum temperatures recorded at the thermometer.
Minima: These occur in the early morning, when the solar panels will have lost their heat.
Maxima: Hot air rises, taking it away from the thermometer. There is almost always some wind at the early afternoon times of maxima. Wind disperses abnormally warm air, and reduces the dwell time of air in contact with the solar panels, reducing the heating effect.
More generally, urban heating only manifests itself when wind speeds are exceptionally low, which almost always only happens at night.
The Urban temperature effect stands out like dogs balls in the data.
Indeed, if you know where to look, here is an example of it at Heathrow and RAF Northolt … but only at night, and only when the wind is very low:
Don’t see your point. If, as you say, wind takes heat away from the thermometer, why does this graph show the highest temperatures coinciding with higher wind speeds?
Wind mixes the air, destroying local influences on temperature, temperatures at the 3 stations were very similar during the middle part of the period shown, when the wind was not even “gentle breeze”.
One of the UEA climate crooks Phil Jones claimed UHI was no more than half a degree. Funny how my car thermometer shows 5 degrees driving out of the London suburbs to the country. I have even seen a 4 degree change driving just 8 miles to the outskirts of Gatwick Airport.
I used to ride a motorcycle back in the 1980’s and even then there was a noticeable drop in temperature on the outskirts of the Borough of Bromley as I went into the countryside.
“It is likely that a nearby solar farm has negligible impact on the maximum and minimum temperatures recorded at the thermometer.”
How likely?
You’re assuming “a nearby solar farm has negligible impact on the maximum and minimum temperatures recorded at the thermometer”. The problem with a lot of what passes for ’science’ – which we are barely allowed to criticise these days – is that it’s full of assumptions. Assumptions are not always correct, therefore conclusions based on assumptions are not always correct.
Well, it’s certainly a convenient assumption for the globalist Marxist twats.
Does the data include sufficient detail so we can see what times the maxima were recorded?
I can’t see the problem, Labour obviously use a different mathematical system, the Foreign Secretary says that 7 comes after 8, so why shouldn’t Mad Ed calculate an average higher, than the highest number in the data……Though it does cause concern about Theives £ 22 billion black hole……maybe it is £ 220 billion…..what is just one 0….when you obviously have no idea where any number goes and yr about to throw Trillions of pounds at a non problem.
I thought Liebour always use the maths genius known as Diane Abbott who can’t even put a pair of shoes on.
As these people are talking about global warming (allegedly man-made) they should look at global temperature change. The only global temperature series which has not been doctored by their custodians to show exaggerated warming is the UAH satellite series, conveniently on the same timescale as the DNZES study:. The graph shows an obvious increase in global temperature since 1980 to the present but it is easy to show that none of it appears to be man-made. First refer to this graph of global cloud cover versus global temperature from 1980 to 2020:. The period 1980 to 2000 was a period of falling cloud cover and global warming through a series of ratchet-like steps (almost certainly nothing to do with man-made CO2) whereas the period from 2000 to 2020 was a period of flat cloud cover and global temperature net flatlining (despite steadily-rising man-made CO2). These periods are shown by the Multivariate ENSO Index to be respectively a preponderance of transient warming El Ninos versus a preponderance of transient cooling La Ninas, extending into 2023: https://psl.noaa.gov/enso/mei/. Referring back to the UAH graph and cherry-picking the readings at 1980 and 2022-23, there is negligible difference between them. The huge spike from 2023 to… Read more »
The problem is though with the average MSM consumer having the attention span of a very stupid goldfish, the chances of them reading all your pretty graphs, or understanding what they mean is zero.
News in general there days works on sound bites. Compress the message down to a few short sentences or you will be ignored.
I think it’s reasonable to assume that ideology will make a hard impact with reality in the near future (ie power cuts etc).
Things could get pretty messy, and he’ll need all the sticks he can get, as there will many sticks fighting back by then.
During the recent disruption to power supplies by Storm Darragh I tried repeatedly to point out to local residents that they would very soon have to look at sorting out how they were going to cope with ongoing power outages and most of the replies told me I was talking b*llox.
RAF Leuchars and RAF Boscombe Down???
Just to go off-topic for a moment, Ed, how’s it going with wind and solar power generation this week? Hitting the targets, are we?
“The average temperature for the period 1991-2020 was said to be 10.3°C, a figure that according to the Met Office has never been reached in a single year.”
Huh? Please provide a link for the second part of this sentence, as it seems to be pivotal, providing part of the title of the article.
I get it now, the official UK average mean temperature, using the entire station network, has not exceeded 10.03C, but it does not seem unreasonable to me that a small subset would get a figure that differs by 0.3C.
Let me guess, you “work” in the press office of the the met office and I claim my 10 pounds.
Averages are meaningless for anything.
The Climate Scam is one where you can say anything you like, then the mainstream media will regurgitate that and no real world evidence is ever required. All you are required to do is say “All scientists agree”——How are they getting away with this fraud? Because propaganda is a very powerful tool. Most ordinary people cannot comprehend being lied to on such a scale so they think it must be the TRUTH
When Trump leaves the Paris accord. Milliband will be buried under an unnamed Ed stone.