Arctic Sea Ice Continues its Stonking Recovery
Arctic sea ice continued its stonking recovery last month, recording its 24th highest level in the 45-year modern satellite record. As reported previously in the Daily Sceptic, the ice climbed to a 21-year high on January 8th. Good news, of course, for ice fans and polar bears, but frankly a bit of a disaster if you are forecasting future summer swimming galas at the North Pole to promote a collectivist Net Zero agenda. Live by the sword, die by the sword – if you cherry-pick the scientific record to state the climate is collapsing, it might be thought you have some explaining to do when the trend reverts to the norm. Just ask coral alarmists about two years of record growth on the Great Barrier Reef. Sadly, explanations there are none, just a deafening, stunned silence.
Arctic sea ice has long been a poster scare for climate Armageddon. But science tells us that it is cyclical and is heavily influenced by ocean currents and atmospheric heat exchanges. It would appear that these chaotic changes are beyond the ability of any computer to process, although a large, well-funded model industry begs to differ. The recovery in Arctic sea ice has been steady if slow and this has enabled the alarums to hang on in the mainstream headlines. Of course it could go into reverse, nobody really knows, least of all Sir David Attenborough who told BBC viewers in 2022 that the summer ice could all be gone by 2035. He relied, needless to say, on a computer model.
Most mainstream climate journalists just print what they are told without looking too closely at the source of the information. The U.S.-based National Snow and Ice Data Centre (NSIDC) is a source of interpretation for trends in polar ice, but care needs to be taken when reading its often gloomy monthly summaries. According to the NSIDC, January sea ice growth was “lower than average” throughout most of the month. It headlined its report: ‘Nothing swift about January sea ice.’ Other interpretations are available. Consider the graph below tracking the ice extent for January over the satellite record.
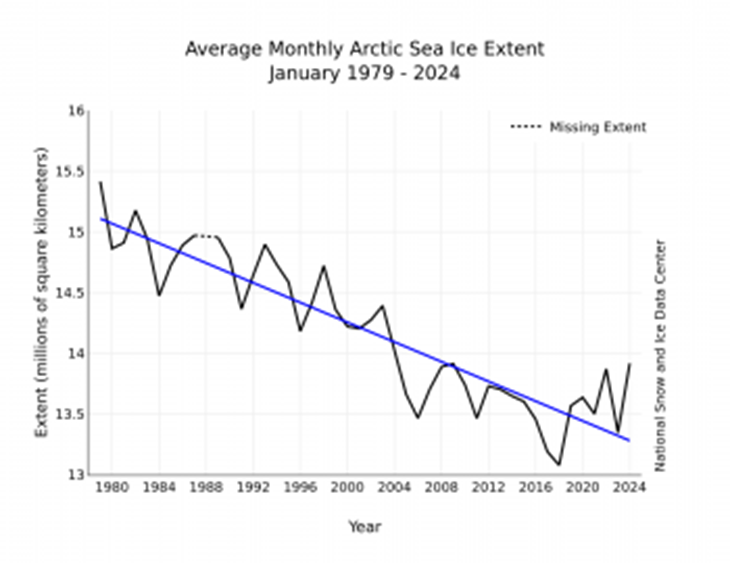
Statisticians can argue over when the sea ice started to recover but there has not been much decline going back to around 2007. In this case January shows a similar trend to that seen in September, the month with the lowest sea ice extent. A moving average line from around the middle of the last decade would show an obvious increase. But the NSIDC reproduces this graph for every individual month and year with a downward linear trend from 1979, a noted high point for recent sea ice. The graph is widely used on social media to counter any suggestion that the ice is recovering.
Note also that the NSIDC claims the January growth extent was “below average”. Well it depends on what average you are using. The NSIDC uses a comparative average from 1981-2010, despite a more recent decade of data being available. It is not hard to see why it prefers 1981-2010 since it includes the higher levels of the 1980s and excludes the lower levels of the 2010s. Taking a 1991-2020 average would likely lead to many more ‘above average’ observations. Data before 1979 is not as accurate, but levels going back to the 1950s suggest much lower sea ice extents. Perish the thought that comparisons should be made with these data or observations made about an obvious cyclical trend seen here and in the historical record going back to the early 1800s.
The NSIDC can spin its figures as much as it likes knowing that in the era of ‘settled’ climate science it is unlikely to be widely challenged. On a more serious note, this unwillingness to question perceived authority and engage in the scientific process gave us Michael E. Mann’s infamous 1998 ‘hockey stick’ graph. This purported to show declining temperatures for 1,000 years followed by a sharp recent uptick caused by human-caused burning of hydrocarbons. The unquestioning acceptance in mainstream media, science and politics can be said to have removed the concept of natural climate variability for a generation and put many Western countries on the road to Net Zero insanity. Now the hockey stick is centre stage in a Washington D.C. libel trial brought by Mann complaining that the journalist Mark Steyn branded his work a fraud. By some accounts, the hockey stick does not seem to be having a great time in the dock.
Professor Abraham Wyner is a distinguished statistician at Mann’s own University of Pennsylvania. Asked on the court stand whether Mann’s hockey stick used manipulative techniques, he replied “yes”. He suggested it was possible that if you knew where you wanted to get to, you can lead yourself into a conclusion different from someone who walked down a different set of paths.
In earlier court documents, Mann claimed wrongly that he was a Nobel laureate, a fact noted during the trial. His hockey stick abolished the Medieval Warming Period, while subsequent leaked Climategate emails referred to “Mike Nature Trick”. This was a practice of using the most convenient proxy or temperature measurements to fit the desired narrative.
In the course of his testimony, Dr. Wyner made comments that strike at the heart of so much that is wrong with the ‘settled’ science pronouncements that seemingly cannot be disputed or even discussed.
And so what happens is, and what is happening today in statistical analysis… we’re in a crisis. A crisis of trust and replication because so many results that were thought to be true turned out not to be true and correct have now gone back and looked at or attempted to be replicated and they didn’t work. Lots of things we thought were true turned out not to be true. It’s a crisis. A problem [my colleague] has identified is due to really bad statistical sets of methods that allow you to get away with choices that would produce a very different result if you did it differently.
What the last two decades or so have shown us is that activists will use any weather outlier or natural disaster to claim the climate is collapsing, or the Earth is “boiling” in the odd universe occupied by UN Secretary-General Antonio Guterres. Statistics are bent to fit the desired narrative whether it be natural waxing and waning of ice levels or typhoon jets landing near a measuring device showing a 60-second 40.3°C temperature blip ‘record’ at RAF Coningsby. Net Zero is starting to unravel thread by thread, and it is time the spotlight was amped up to maximum to shine a light on all the dodgy science used to promote this horrendous reset of human society.
Chris Morrison is the Daily Sceptic’s Environment Editor.
To join in with the discussion please make a donation to The Daily Sceptic.
Profanity and abuse will be removed and may lead to a permanent ban.
The problem with “beliefs” is that you have to do an awful lot of unbelieving in order to support your “belief”————-Facts are to the believer considered some kind of treason. –
I don’t believe sea ice statistics any more than I believe inflation or GDP statistics.
When I read that the ONS or whoever has revised its inflation or GDP growth figure up or down from 1.2% to 1.3% or whenever the figure is that day, my first though is “what a load of b*ll*cks”.
The one that really kills me is when they tell us the temperature of the planet.
These figures are the tools of policy makers, bureaucrats and academics to make themselves appear authoritative and on top of their subject matter.
They are part of a massive confidence trick to persuade the public to let them make decisions for them, because they know best. Look how clever they are, they can produce a number for you.
A quick look into how these figures are produced shows what a load of nonsense they are.
I don’t believe them when they supposedly help my position any more than I believe them when they go against my position.
Lies, damned lies and statistics….totally agree as these clowns know anything. 700.000 years ago man invented fire….whatever clown boy.
The covid clown show was where they really took it too far.
A positive covid test could mean you were either on the verge of death, had a really bad cold, were feeling a bit under the weather or were perfectly fine.
And yet they would aggregate all those positive tests and present them as if they meant something.
Make no mistake that the more extreme element of the climate change establishment, which these days is becoming almost the whole of the political class of the wealthy west, would like to have climate lockdowns. They saw how timidly we surrendered freedoms over the covid scare and a climate lockdown is something we have not seen mentioned on mainstream news as such but trust me that is the direction of travel especially in places like the UK who have forced themselves in law to achieve Net Zero by 2050. Even though this is pretty much impossible unless draconian measures are put in place eg a climate lockdown. This would limit travel, access to petrol and diesel and gas for central heating etc. ——–If this sounds to many people implausible then thy should think again.
“And yet they would aggregate all those positive tests and present them as if they meant something.”
I had countless arguments with people at the time about this. They used to say things like “yes, but covid cases are up!” or “yes, but there were 1,000 covid cases yesterday” and I would ask them to explain what that meant – compared to what, what implications did it have etc. None of them could ever answer, they just got huffy and refused to engage further because they didn’t want to face the fact that they’d been told nonsense. Hopeless.
Do they just put a thermometer under the Earths tongue and take a reading? ——-I have posted regularly on the “global temperature” nonsense. There are some things that lose their meaning when you average hem and temperature is one of those things. Basically because temperature isn’t an amount of anything, it is just a condition.
You get a more reliable reading up the jacksie, as I understand.
So that’ll make it south London.
The graph goes back to 1980. There is 30 years more data available from the DMO and the shows no trends in reduction whatsoever, over 70 years, which in the scheme of things is not that long a period to begin with.
But that is The Science. Distort those graphs so the within range variability can be marketed as an eco disaster – from human plant food emissions – and marketed as the ‘hottest winter evah…’
But also if you go back before 1979 the temperature record was thermometer based. Those thermometers were not all over the world. They were mainly in wealthy western countries and they were actually quite sparse as records coverage. Then you have the accuracy problem where a thermometer that started out in a field somewhere would over time be surrounded by concrete and tarmac, with vehicles whizzing by. So the raw data had then to be homogenised (adjusted). But these thermometers in the first place were never designed for the kind of accuracies now being claimed. eg tenths of a degree. The general public are led to believe that a there is some single number that represents the temperature of earth where in fact there are an infinite number of temperatures. ——Temperature is a FIELD.
Totally agree. There is no global temp. Most of the planet is free of temp stations. How anyone could come up with a temp for a massive area like the Arctic is just hocus pocus magic and made up numbers. In the long view of history it is junk science. But science is now a religion. Believe and follow….or else.
Doubtless the DC jury will find in the appalling Mann’s favour as their own careers would be irreparably damaged if they didn’t. Sad but true I fear.
The Graph cannot be found in Manns favour. It has already been shown to be flawed (wrong). I think this trial is about intent and whether it was deliberate fraud. ——-But when a person (Mann) would not release his data, computer code or methodology to statistician Steve McIntyre so that he could check the work for himself then alarm bells should ring. In science results have to be reproducible, and no one can reproduce something if they have no access to the material.
How much do you bet, Wokeman? I have no doubt that the jury will find against Mann, in favour of Mark Steyn, because they have heard the evidence.
I don’t want to bet I just hope you are correct.
Sadly I was wrong. I’ve overestimated people’s intelligence and common sense. Things are worse than I thought, in Washington at least.
Since when have Washington juries based their verdicts on the evidence?
You will likely have seen this before but it bears repeating. Tony Heller exposed the deception in using 1979 as a starting point for sea ice:
As he does relentlessly – certainly hope MS has him on speed dial ..
Whatever happened to the ice-free Arctic?
leaflet to print at home and deliver to neighbours or forward to politicians, media, friends online.
Many thanks Chris for another lucid take-down of the climate groupthink. Fingers crossed for a rational decision for Mark Steyn.