Can You Prove Anything with Statistics?
Some people say ‘you can prove anything with statistics’. It doesn’t seem like a very intelligent or constructive observation – but perhaps they’re onto something.
In a paper published in Proceedings of the National Academy of Sciences, Nate Breznau and colleagues outline an intriguing study where teams of social scientists tested the same hypothesis using the same data, but got radically different results. Here’s how it worked.
Seventy-three teams of social scientists were invited to take part. The aim of the study was to gauge the extent to which idiosyncratic decisions by researchers influence the results of their statistical analyses. All teams were given the same data and asked to test the same hypothesis, namely “that greater immigration reduces support for social policies among the public”.
After analysing the data, each team submitted their results, along with details of the models they had run. The researchers behind the study examined all the models and identified 107 different analytical decisions. These comprised things like which variables were included, which type of model was used and whether any data were excluded.
They then performed their own analysis to see whether variation in teams’ results could be explained by the analytical decisions they had made. Did teams that included the same variables get similar results? Did teams that used the same type of models get similar results? Etcetera.
First things first, though. How similar were teams’ results overall? Did most of them find support for the hypothesis “that greater immigration reduces support for social policies among the public”?
The answer is shown in the chart below. Each coloured dash represents a different statistical estimate submitted by one of the teams. (There are more than 73 because some teams submitted more than one.) The horizontal axis ranks the estimates from smallest to largest. The vertical axis indicates their exact size and whether they are positive or negative.
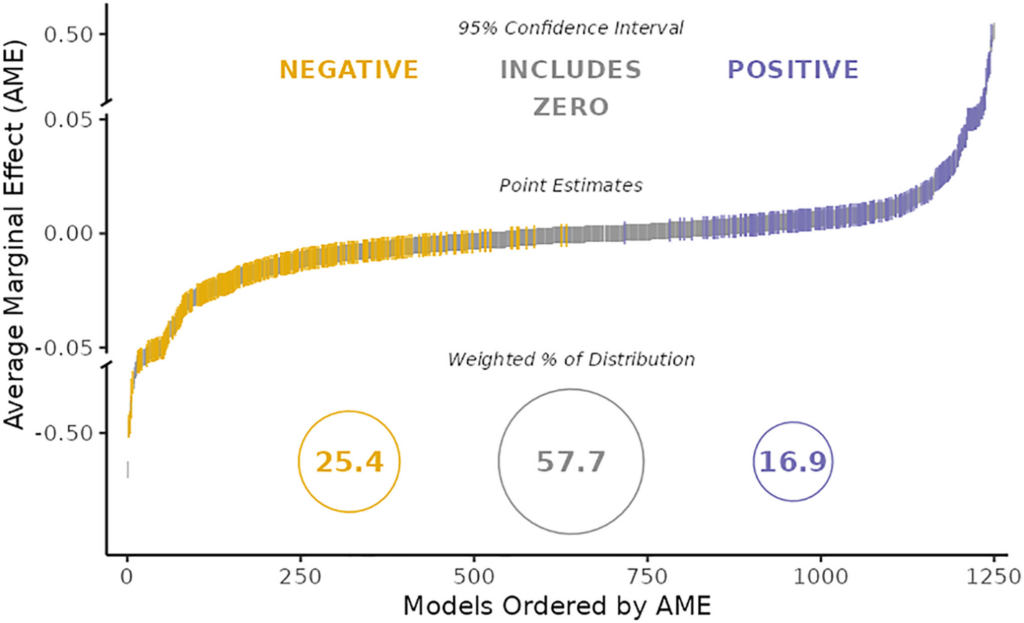
As you can see, teams’ results were highly dissimilar. Some submitted moderately large negative effects (shown in yellow); some submitted null results (shown in grey); and some submitted moderately large positive effects (shown in purple).
In other words, there was absolutely no consensus as to whether greater immigration reduces support for social policies. Some teams found that it does; others found that it doesn’t; and still others reported mixed results. This was despite the fact that all teams had exactly the same data.
Were Breznau and colleagues able to explain variation in teams’ results with reference to the analytical decisions they made?
The answer is shown in the chart below. Each of the four bars represents a different way of measuring the variation in teams’ results. Colours represent different explanatory factors – analytical decisions are shown in green. (Breznau and colleagues also checked to see whether things like researcher characteristics mattered.)
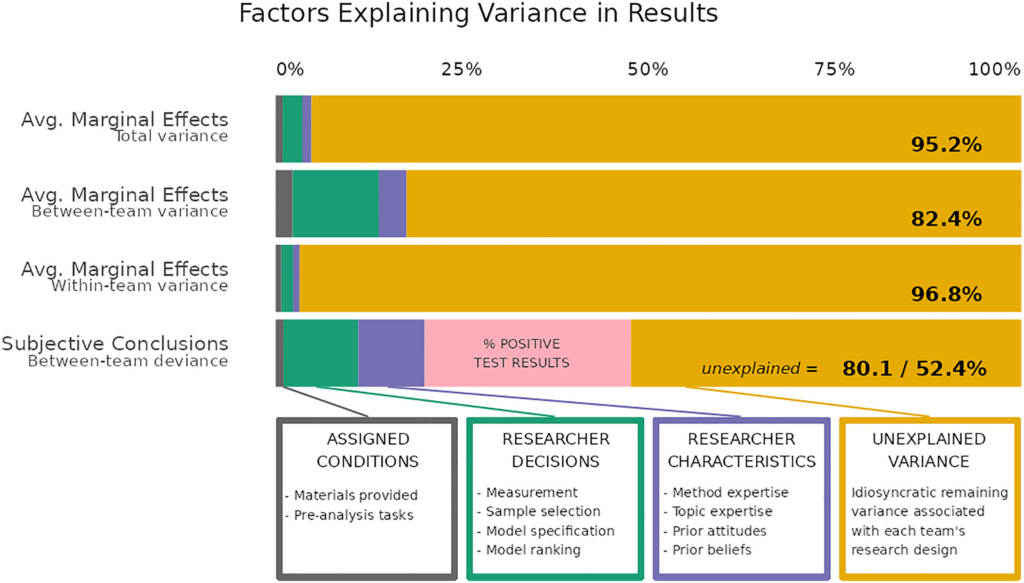
As you can see, the vast majority of variation in teams’ results went unexplained. When you think about it, this is a remarkable finding. Social scientists tested the same hypothesis using the same data, and got radically different results. Yet the analytical decisions they made don’t seem to explain why they got such different results.
What else could explain it? Here’s a quote from the paper:
Researchers must make analytical decisions so minute that they often do not even register as decisions. Instead, they go unnoticed as nondeliberate actions following ostensibly standard operating procedures. Our study shows that, when taken as a whole, these hundreds of decisions combine to be far from trivial.
Social scientists have plenty of reasons to feel humble. Breznau and colleagues just gave them one more.
Stop Press: Breznau and colleagues’ paper has been criticised for overstating the variation in teams’ results. Maya Mathur and colleagues point out that 90% of the standardised effect sizes were between –0.037 and 0.037, suggesting a consensus of little or no effect.
To join in with the discussion please make a donation to The Daily Sceptic.
Profanity and abuse will be removed and may lead to a permanent ban.
Yes. You can prove anything with statistics.
Here is a favourite one of my own invention. In Wales, 99.3972% of the population have a greater than average number of legs.
The population of Wales is 3,107,494. Using the following (invented, but choose you own actual numbers) facts, a total of 18,732 people have sadly lost a leg, or both legs, through accident or disease. Specifically, 15,672 people have lost one leg, and 3,060 have lost both legs.
The total number of legs in Wales is therefore:
(3,107,494 – 18,732) *2 (people with 2 legs)
Plus
(15,672) * 1 (people with 1 leg)
Plus
3,060 * 0 (people who have sadly lost both legs)
Total number of legs = 6,193,196
Average number of legs = 6,193,196 / 3,107,494 = 1.992987 legs per person
So everyone with 2 legs has a greater than average number of legs … 99.3972%
[Please don’t take offence, I don’t mean to make light of disability. But this example illustrates how ‘true and accurate’ statistics can be deliberately used to mislead. We must beware of people who use statistics as a drunk uses a lampost – more for support than illumination.]
There are some people who are going to be hopping mad about that.
That’s obviously a fallacy: As defined, people can only have an integral number of legs (0, 1 or 2) and hence, 1.992987 is a meaningless outcome for number of legs.
A person could have half a leg, or three-quarters of a leg, etc.
Not as defined in the original description. That’s basically a function f(x) mapping the person x to a number of legs and the value set (Wertemenge, no idea if value set is the proper English term) of this function is {0, 1, 2}. The so-called average is outside of this value set and hence, it’s just an invalid value.
Is that an example of proof by intimidation?
“Proof by Intimidation
Description: Making an argument purposely difficult to understand in an attempt to intimidate your audience into accepting it…”
https://www.logicallyfallacious.com/logicalfallacies/Proof-by-Intimidation
It is mathematically correct though, and the derived statistic is not!
No. It’s really basic math, about 7th form level.
Close to correct, but possibly for the wrong reason. Why do so many not like this comment? In some ways I like the idea of a closed results field {0,1,2} but then “average” as sumof(results)/membersof(results) is not valid as / (divide) must return an integer result as a member of the results field. Oh, so easy to do stupid things with statistics!
There is of course the well-known proof by intimidation approach from A Random Walk in Science.
Search for the book, there are pdfs online. Look for the part about proofs and horses.
🤣 Excellent! Here’s another one:
Three brothers want to buy a second hand telly they saw in the shop sale , cost £30.
So they all give the errand boy a tenner each to go and buy it for them as they are busy.
When he gets to the shop he finds the price has been cut again to £25!, so he buys the telly and is given 5 x £1 coins in change,
He then trousers £2 for running the errand and gives each brother £1 back! You with me so far?
Each brother has now paid £9 each, the boy pocketed £2, … 3 x 9 are 27, plus the 2 pound for the boy, that’s £29 in all ! Where did the other pound go?
You can actually do this with real cash!
Statistics are a bummer!
Good one. I had to think about it. Don’t read on if you don’t want it explained:
The three £9s went towards the TV + the boy’s £2.
So the £2 has already been accounted for.
Therefore you don’t add the £2 to the £27, as that would be counting it twice.
So there is no “other pound”.
The boy and the TV seller between them have £27 out of the £30. That just leaves £3 out of the £30 to be accounted for, which the three men have, £1 each.
Well answered👍but, Imagine how governments could use this kind of statistical coversion to hide tax payer millions!
There is no other pound. The boy got £30. He spent £25 on the telly and returned £3. That makes £28. And took the remaining £2. Total £30.
That’s what I noticed immediately before thinking about what’s precisely wrong with the incorrect calculation supposed to fool people into believing there must have been another pound.
“Please don’t take offence, I don’t mean to make light of disability.”
I hope that’s tongue in cheek and you’re not seriously concerned that someone might take offence!
I wonder why NONE of the commenters here have seen why this claim is actually untrue? Which statistical rule has been broken? A clue: what statistical meaning does “average” have, the case above abuses average to confuse everybody?
Which average are you using ——mean? median? etc etc
Important when considering ‘climate’ is an average of meteorological data taken over long periods.
Thus 50% of say, temperatures or rainfall will be above average, 50% below, and 5% will be extreme at either end.
The longer the averaging period, the more the extremes and variations are smoothed out. This is very inconvenient if you want a weather extreme to ‘prove’ global warming/climate change: ‘It’s worse than we thought’™️
And we have the ‘obesity epidemic’ also based on averages.
Averages don’t exist – ever met the average man or woman? – but they abound in The Science™️.
Also averaging meteorological data over a “long period of time” tells you nothing about what the cause of the supposed changes you detected were. It also tells you nothing about the period before you started measuring. eg— If we start recording temperatures in 1860 we would not have the very cold period before 1860 in the data. Climate data and the assumptions made about it are entirely dependent on the period you select to measure, and the assumptions you make regarding what caused what you have just measured.
It used to be called sociology, and it has now become a science. I suggest that in the light of these results it goes back to sociology, as there doesn’t seem to be a lot of science going on.
There don’t seem to be any objective metrics involved. All measurement is subjective and as such, affected by bias and opinion. The results of this exercise seem to bear that out.
This is bloody hilarious. Different sociologists will find different conclusions from the same data – funny. But I particularly enjoyed the final finding that ‘most of the time we can’t see how they did that‘ (my phrasing).
That’s the expected outcome of applying the same flawed method to a different data analysis problem. It obviously still won’t produce anything which makes sense.
It is worth looking into the philosophy of statistics. It has been pointed out for a long time that philosophers know little of science and scientists generally know nothing about the philosophy of science. I would advise proactive measures because the benefits would be colossal based on a small investment. In Norway for example, basic philosophy study in the first year is considered to be a requisite for further study because if you inwardly digested the philsophy then your mind as a scientist or searcher will be infinitely richer. Just a few small steps in the ordering of things makes a huge difference.
“Ah yes Science. One gets such wholesale returns of conjecture from such a trifling investment of fact”——Mark Twain.
Count up the times that you have had an emotional response because of statistics before you’ve even had a chance to think about the information. It is inteesting how statistics can affect us. How many of those impressions made by statistics are completely forgotten yet engraved on your value system.
That’s a bit of an idiotic experiment because if the thesis is true, social scientists examining other social scientists using the same set of flawed-but-we-don’t-know-how methods cannot possibly have a meaningful result: 73 teams of social scientists produced gibberish for reasons unknown to us (like, say, that’s all social scientists ever do) and a 74th team took all this gibberish and destilled it into meta-gibberish. But as meta-gibberish is also just gibberish, that wasn’t really a different kind of result.
OTOH, the hypothesis was already gibberish because social policy is a term that’s impossible to define in an objectively measurable way. What is or isn’t a social policy is entirely a matter of opinion.
The issue isn’t the validity of these pronouncements the issue is how they affect public consciousness. Anyone who deals with numbers or data knows how humble you have to be in terms of interpretation. These discussions are essentially walled off enclave discussions when the rest of civilisation is burning. And it has been more and more an attack on the common folk all around the world. You need to get a grasp of the entirety because the future won’t allow anything less.
A friend of mine maintained that the only possible outcome of social science studies is ‘some do, some don’t’.
If a new disease came out and it was suddenly promounced that 97 percent of those infected would die – how many do you think would actually look into that claim? Most would just hunker down ans do what they are told. We have to be realistic about this.
There is no risk averse future. I feel isolated in that I long for the survival of my fellow Brits and the energy is all over the place. Physical courage is easy to obtain you can do it by practicing sport or martial art. Moral courage is more difficult and you need to have that too.The future is meaningless without it.
During the pandemic we found out that any idiot can draw a straight line on a log-plot never mind that the line was curved.
Off topic but nobody looks at the News Round-Up at this time. Just a couple of the latest news stories doing the rounds but I’ve no idea if these are legit or what. Probably because there’s so much BS out there to navigate. The DM are even running a story that the German tourist, Shani Louk, is alive and in a critical condition, according to her mother. The bank notified her that her credit card was being used in Gaza. This is obviously an extremely cruel wind-up, going by the footage we all saw I find that very hard to believe. This too is monstrous, which I really hope is not true, first casualty of war being the truth, and all that.. ”Soldiers encounter unimaginable horrors as they remove the bodies of victims, including about 40 babies and small children — some with their heads chopped off Press were invited on Tuesday to survey the scene of devastation in Kfar Aza, the community massacred by Hamas terrorist infiltrators, as the IDF continues to remove bodies of victims from the homes where they were murdered. For the first time the Israeli army let media channels into one of the massacred communities,… Read more »
Providing this good 3min video for balance and to illustrate that it’s always best to remain sceptical. At least until there’s been official confirmation. Plus, the faked footage from all over during the scamdemic is still fresh in my mind. It’s like ‘the boy who cried wolf’ X1000 at the minute.
https://twitter.com/c_plushie/status/1711817389107728492
What is the difference between dropping bombs from fighter jets?.. Is it purly that the brutality is carried out by hand?
How can one be distraught at the brutality of one death and demand it against another.
There’s so much of this level of reporting that just doesn’t add up.
Over the past few years, before this recent event, 6000 Palestinians have been killed and 300 Israelis… How does this fact mean nothing to most…
It depends if your statistical method is the correct one. I recall statistician Steve McIntyre dismantling the Hockey Stick Graph, which purported to show flat temperatures on earth for 1000 years and then a sharp uptick in the 20th century, because of it’s dodgy statistics. He achieved this after 5 years of work since the authors of the graph refused to provide their computer code, data or method. So you can get away with stuff only for as long as someone who knows what they are doing comes along. And it is clear they were trying to get away with something by the fact they were not prepared to give others the information required to check their work.
Social Scientist is an oxymoron
Models.
I stopped reading after I saw that.
You can lie about anything with statistics.