40% of Apparent Global Warming Since 1850 is Due to Urban Heat Corruptions, Major Study Finds
A major new study involving 37 scientists from 18 countries has concluded that global temperature estimates since 1850 have been heavily contaminated by the growth of urban heat where the thermometers are sited. The UN-backed Intergovernmental Panel on Climate Change (IPCC) claims that urban heat accounts for less than 10% of recorded global warming, but the scientists found that figure is nearer 40%. They observe that a rural-and-urban blend of temperatures indicates a long-term warming trend of 0.89°C per century, while a rural-only collection shows only a rise of 0.55°C in the same time period.
The IPCC bets the ranch on humans causing all or most global warming in the modern age. It promotes the idea that temperatures have risen since 1850 by 1.09°C, with natural influences contributing only –0.1°C to +0.1°C – statistical-speak for zero. As I argued in the Daily Sceptic on Sunday, this is a political construction designed to promote Net Zero. Given our current state of scientific knowledge, it is impossible to calculate how much of the recent warming is due to the small amount of carbon dioxide humans produce by burning fossil fuel compared to natural climatic variations.
It is perhaps not generally known that the IPCC’s position that humans cause all global warming is mainly based on a comparison of global temperature estimates, with ‘hindcasts’ produced by computer models. The authors of the new study explain that these are retrospective ‘forecasts’ of past climate produced by CMIP6 model simulations. They argue that these simulations are contaminated by urban heat distortions, and the use of a “low solar variability” estimate. Both problems could significantly affect the IPCC anthropogenic attributions made in the fifth assessment report (AR5), and repeated in the latest edition known as AR6. The charge is that the IPCC downplays the effect of solar irradiance (sunshine) which can explain a great deal of the warming since the late 19th century.
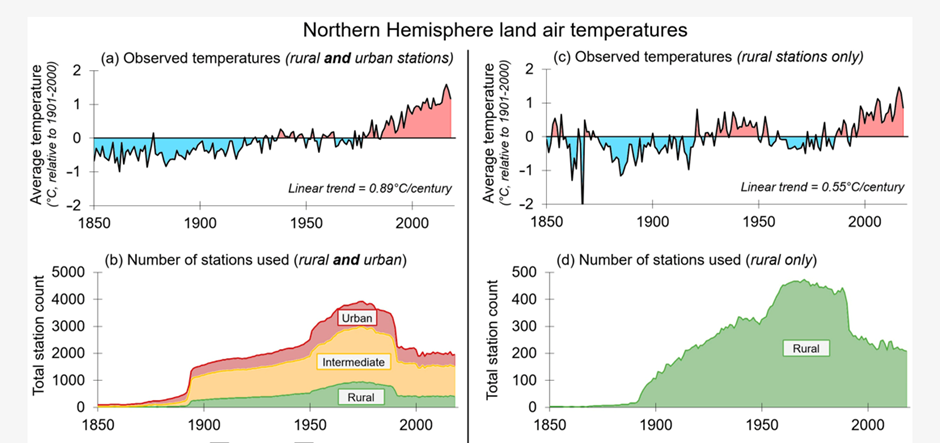
The graphs above demonstrate the two different estimates of Northern Hemisphere land air temperatures from 1850-2018. Both series were generated from the Global Historical Climatology Network (GHCN), a database of temperature records from 180 countries compiled by the U.S. weather service NOAA. They show clearly that in rural areas away from heat generated by humans, the warming is much less, particularly in recent times during a period of large urban expansion. It is obvious that temperatures avoiding any human corruption provide the best guide to any long-term climate trend.
This latest paper, published in the scientific journal Climate, is one of a series of academic warnings that global temperature datasets are severely contaminated by unadjusted urban heat effects. The IPCC continues to hide its head in the sand, stating that no recent findings have emerged to alter its view that any uncorrected effects from urbanisation, or from changes in land use or cover, have raised land surface air temperature trends by more than 10%. The IPCC was set up in 1988 only to look at human influences on the climate, so it is not hard to understand why it doesn’t seem to try very hard to investigate the problem. No such reticence holds back Dr. Roy Spencer and Professor John Christy of the University of Alabama in Huntsville. They looked at the GHCN and found that up to a fifth of all global warming reported by 20,000 weather stations was invalid due to corruptions from non-climatic data. Worse, they found that NOAA, far from removing urban heat distortions, was on average “spuriously warming station temperature data trends when it should be cooling them”.
The U.S. meteorologist Anthony Watts has spent the last decade highlighting the numerous flaws built into global temperature datasets. Data are collected by Government bodies from a weather station network “that was never intended to detect a global warming signal”, he notes. His seminal work recently found that 96% of U.S. weather stations are “corrupted” by the localised effects of urbanisation. The American temperature data form an important part of the over-heating global record. In Watt’s view, there is only one weather station network accurate enough to detect a climate change signal. It was set up in 2005 by NOAA as a state-of-the art system using 114 stations across the States specifically located away from any non-climatic effects like urban heating.
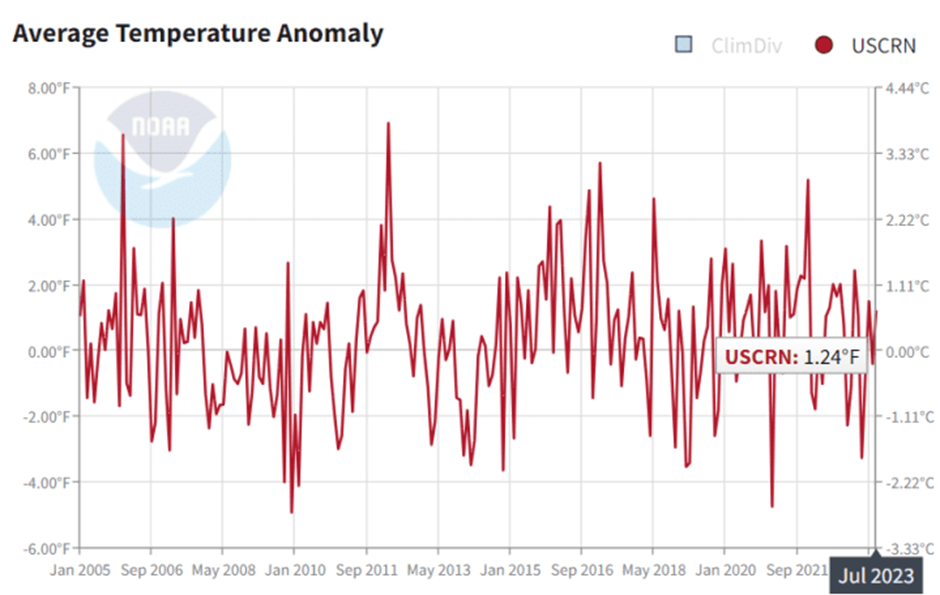
The network is called the U.S. Climate Reference Network and its findings over the last 18 years can be seen in the graph above. It shows little warming over this period, a fact that leads Watt to conclude that its findings are “buried” by the U.S. Government.
Far from correcting global warming figures, the main temperature datasets have a habit of retrospectively adjusting upwards many of their past results. Recently, Professor Ole Humlum noted that since January 2008, NASA had boosted warming identified at its GISS service by 49% between 1910-2000, a rise in temperature from 0.45°C to 0.67°C. Similar retrospective rises were also spotted by the recently-published report from Clintel, noting that the state-funded U.K. Met Office had boosted temperature by 38%, or 0.2°C, in the previously pause-ridden period from 2000-2020. The Met Office’s HadCRUT5 is also said to have cooled the period 1850-1900 by 37%, although why it took so long to get around to this last task is a bit of a mystery. It does however improve the ‘hockey stick’ temperature look, and that is most helpful to political promoters of Net Zero collectivisation.
The current state of play is well summed up by the 37 scientists who noted in their recently published paper: “The scientific community is not yet in a position to confidently establish whether the warming since 1850 is mostly human-caused, mostly natural, or some combination.”
Chris Morrison is the Daily Sceptic’s Environment Editor.
To join in with the discussion please make a donation to The Daily Sceptic.
Profanity and abuse will be removed and may lead to a permanent ban.
Who’d have imagined? At the dawn of modern weather records people set their monitoring equipment near their place of work to take regular readings, transport being not so widespread at the time, then, progress improves, cities grow, more and more concrete and tarmac, bigger buildings and all this now surrounds thier monitoring stations! And low and behold, long term heat rises are recorded, wow, Shock horror!
And we use this data to allow little Swedish girls to scare the world into a mindless frenzy of destruction of our way of life?
Give me fecking strength!
This article is spot on. We’ve added 2 billion (net) people to the planet in the last 23 years. That’s the equivalent of about 200 London sized cities. Today, once again, London will be the UK’s hottest place due to urban island heat trapping. In countries around the world the biggest cities are more times than not warmer than the surrounding countryside.
There’s another human caused factor which also increases temperature readings: Deforestation. Plunk a thermometer in the shade of a large forest/jungle and it will read a lower temperature than a thermometer placed in a cleared area even though said reading will also be taken in the “shade” inside some sort of enclosure.
Most “Climate Change” is entirely natural, just as it has been over the millennia. Any human caused change is entirely due to increasing populations resulting in more cities and less forested land.
It’s NOT CO2, it never had anything to do with CO2 and it’s critical that we find ways for the Mainstream Media to acknowledge these inconvenient facts before Western governments destroy their economies as a result of their stupid and corrupt quest for their dumb-ass Net Zero nonsense.
Are you 77 Brigade?
Utter bullshit.
? What’s bullshit?
Was this comment meant for another article??
All the datasets used in the above discussion are land based and as such ignore over 2/3rds of the Earth’s surface.
The oceans are a major influence on global temperatures because of their ability to store heat. As the oceans are fluid, the heat at the surface is distributed by motion within the water produced by tides, currents and wind, as is geothermal heat from the underlying rock.
Land on the other hand heats and cools quickly (look at the variation in temperatures in deserts over just 24 hours); there are no fluid heat transfer mechanisms in soil . The nature of the land has been changed by man over the years, and in recent history not only will increasing urbanisation have an effect, but also deforestation and industrial farming methods to cope with increasing population. Temperature measurements are for convenience taken mainly from inhabited areas where these land change effects are likely to have most impact.
As a consequence it is hubristic for scientists to claim that these are anything other than just interesting and have any predictive value.
The BBC takes every opportunity these days to warn of the impending disaster that will come upon us if we don’t all do as we are told: “A heat-health alert has been issued for most parts of England as temperatures could reach 32C (89.6F) midweek. …The hot weather comes after what has generally been regarded as a summer of poor weather for much of the UK…. … Heatwaves are becoming more likely and more extreme because of climate change.” https://www.bbc.co.uk/news/uk-66710496 Despite “a summer of poor weather for much of the UK”, it’s undeniable that there was hot weather at the beginning of this summer, and now we’re having a bit more hot weather at the end of this summer. So that’s clear evidence of a climate change crisis. We’re not supposed to have hot weather in summer. I can still remember all those summers when I was growing up when it was always cool or warm spring-like or autumn-like weather every summer from May to September, never any heatwaves. I think I can remember one heatwave in 1995, though that was probably the beginning of the global warming crisis, as it was then known. Every month now somewhere in the… Read more »
I remember the days when we could bask in what would be termed an ‘Indian Summer’. Now we’re being patrolled by the climate alarmists who jump at their own shadows and call this the era of ‘global boiling’ Cue enormous wave of hysterical laughter…
Well I don’t know about you, but I’m boiling on this Indian summer’s day, so that’s proof that we’re living in the era of ‘global boiling’.
And I wouldn’t use the term ‘Indian summer’ if I were you, as that’s racist.
https://www.walesonline.co.uk/news/uk-news/term-indian-summer-racist-25278831#:~:text=The%20exact%20origins%20are%20uncertain,autumn%20when%20Native%20Americans%20hunted.
I prefer to call it a ‘gypsy summer’, as it’s called in Bulgaria.
Depends how you class “a heat wave”
Every weather anomaly (if there’s such a thing) has now been downgraded so much that all weather is extreme!
I just can’t decide if you’re being ironic or not. Reassure me.
Again and again, reports and findings arrive to counter the dominant narrative yet fall on deaf ears and blind eyes. It is increasingly obvious that we are being lied to on a monumental scale and that what we are being told to accept meekly is nothing more that the destruction of our way of life, the end of our liberties and freedoms and to believe that black is white and up is down. No one but a fool would carry on believing this and at any other time we would rise up and fight those who would oppress us with tooth and nail to the bitter end. BUT we don’t because we live at this time. Our voices are not heard, our arguments are dismissed and we are minimised. I do wonder sometimes how many of ‘us’ there are. Looking at ‘likes’ etc on Mike Yeadon’s Telegram channel, and other Youtube truth channels, it doesn’t amount to that many. I guess we’ll find out soon enough.
There’s no doubt that a loss of confidence in much of the output from certain organisations is justified. What I am aware of is that there is a noticeable change in the minimum temperature values following suburban development. Where I am, 30 odd years ago it was almost rural, but now a lot of it has been built on, and the severity of surface frost is a lot less than the mid 1980s. Back then, we had some mornings when the air temp was down to -15 °C, but that doesn’t happen now. Still have to be careful about frost though, being just about as far away from the sea one can be in England.
“40% of Apparent Global Warming Since 1850 is
DueOwing to Urban Heat Corruptions, Major Study Finds”Small point, but journalistic standards and all.
“Due to” refers to time.
Out and about this (lovely hot) afternoon: 27 degs in my shady lane, 31.5 in a local town, 28.5 degrees going cross country. That gives a local average of 27.75 rurally, 29 including the urban heat island, but the climatistas would no doubt report the 31.5.
net zero is lunacy .. nothing more that howling at the sun and moon ..
it will achieve nothing
The warming is all in the adjustments. Temperature data has been fiddled about with more than a hooker’s knickers. The past was cooled and the present warmed all in support of politics.——Who remembers climategate? Who remembers The Hockey Stick Graph where we were told that the earth had a stable temperature for 1000 years then the temperature suddenly shot up in the 20th century? This was plastered all over the media as “evidence” of global warming. Except it WASN’T. A statistician called Steve McIntyre tried to get date, methodology and computer code from the authors of this graph so he could check their work. That information was not forthcoming. They refused to provide it. WHY? In science isn’t it the case that results have to be reproducible by others? YES OFCOURSE. ——-So why then did they withhold their data? Well it took McIntyre about 5 years of graft without the data he requested to show that the graph was statistically flawed, and it was then never to be seen again on TV or in journals. It is the same everywhere you look on this issue. It is mostly a smidgeon of the truth elevated into a planetary emergency but with… Read more »