Vaccinated Over-Represented in All-Cause Deaths, ONS Data Show
The new official data on deaths by vaccination status in England were released on Tuesday by the ONS and they show the vaccinated are over-represented in all-cause mortality in all age groups for most of 2021 and all of 2022.
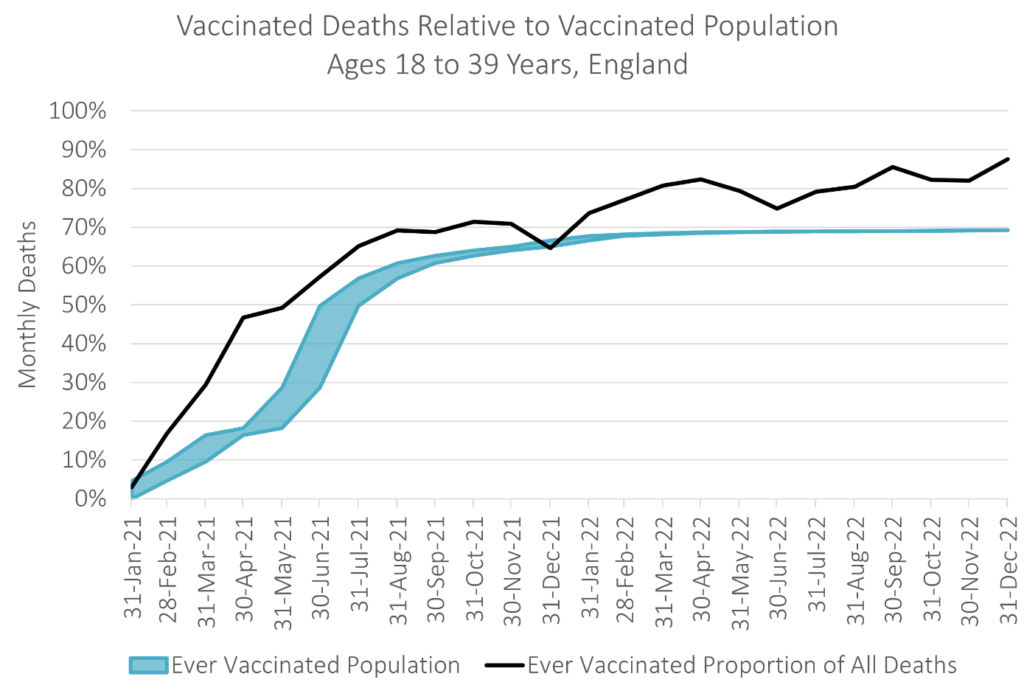
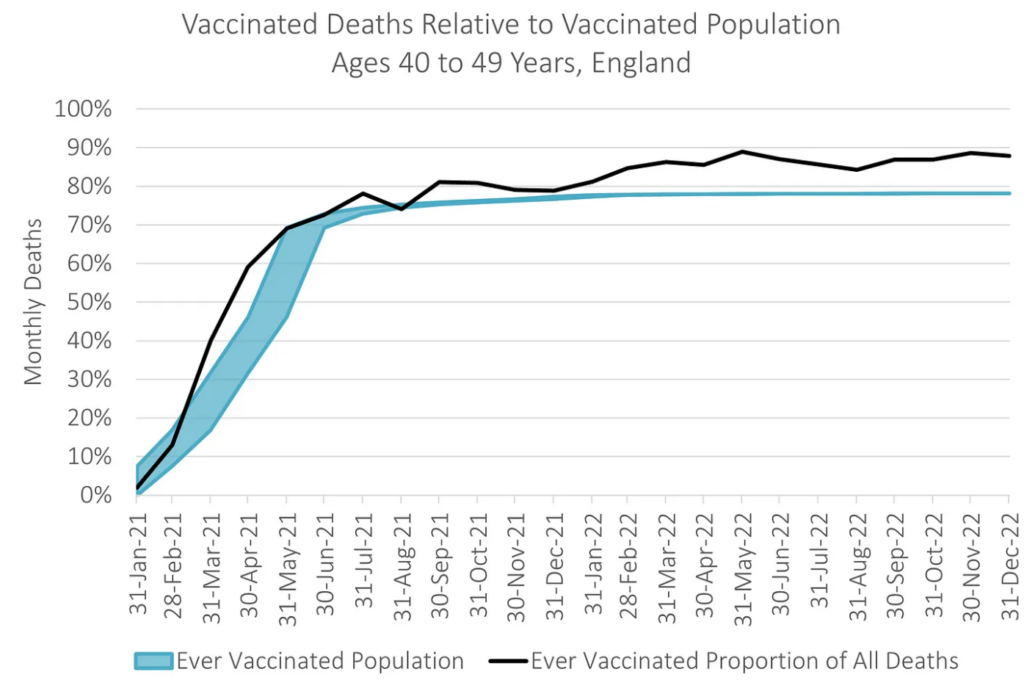
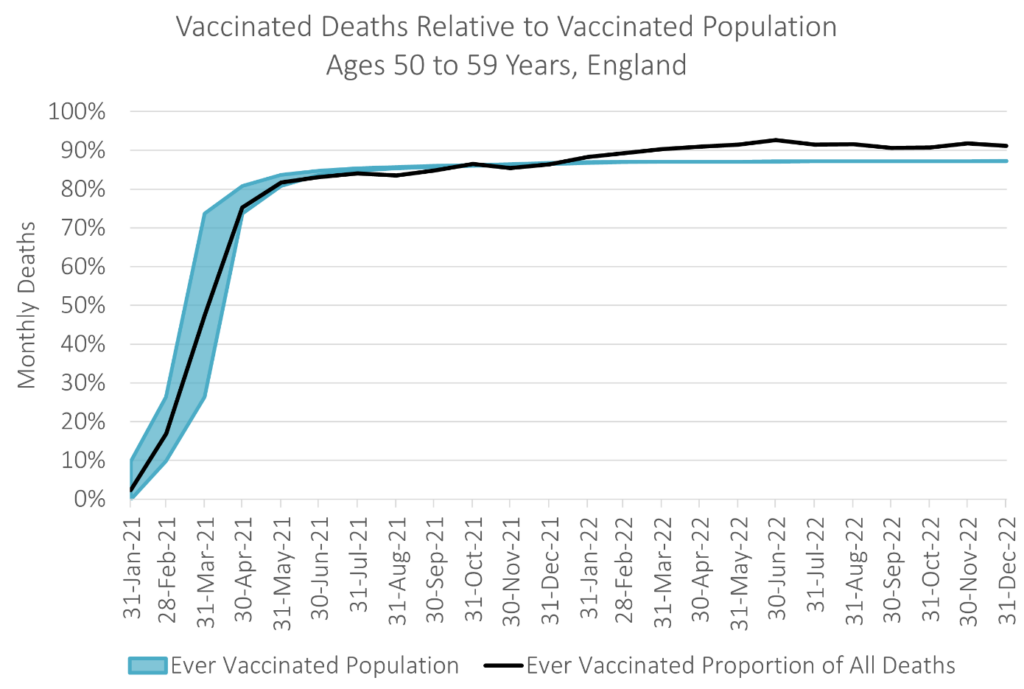
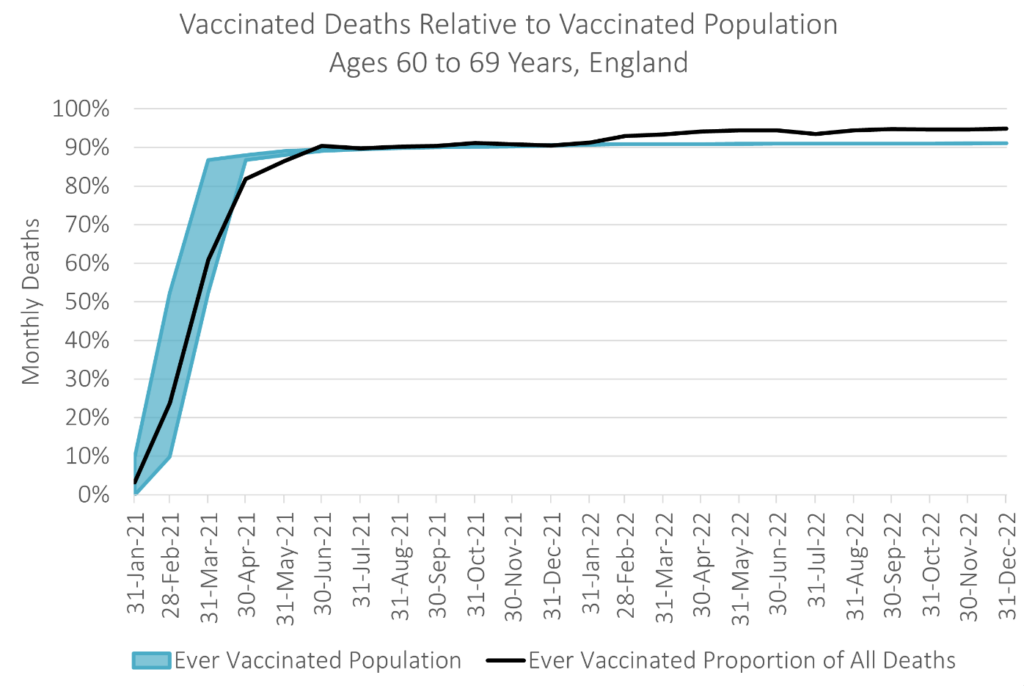
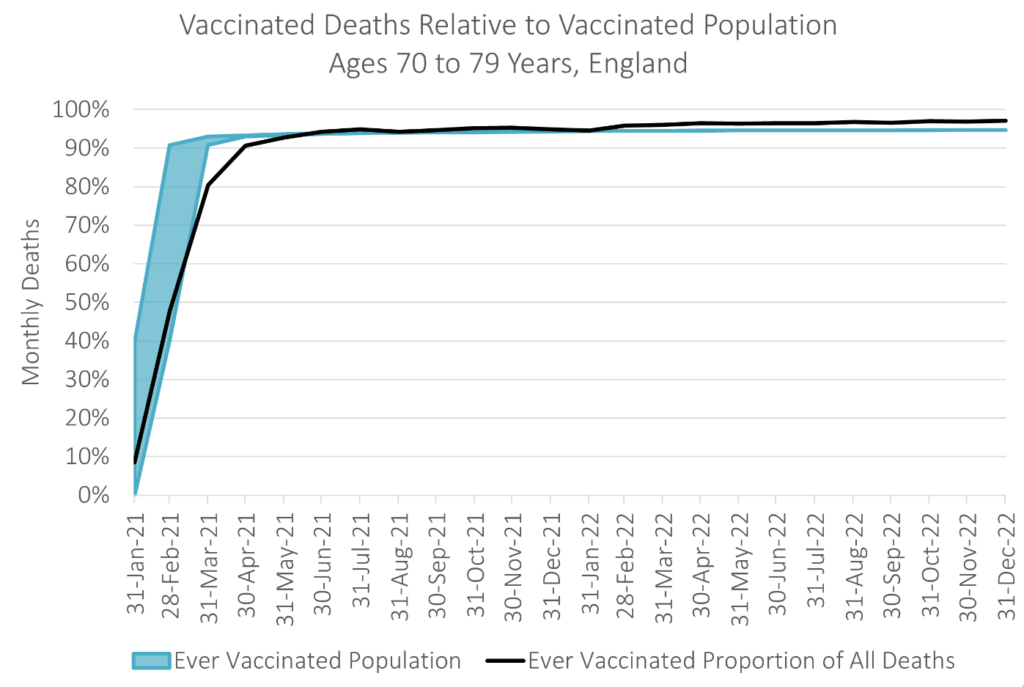
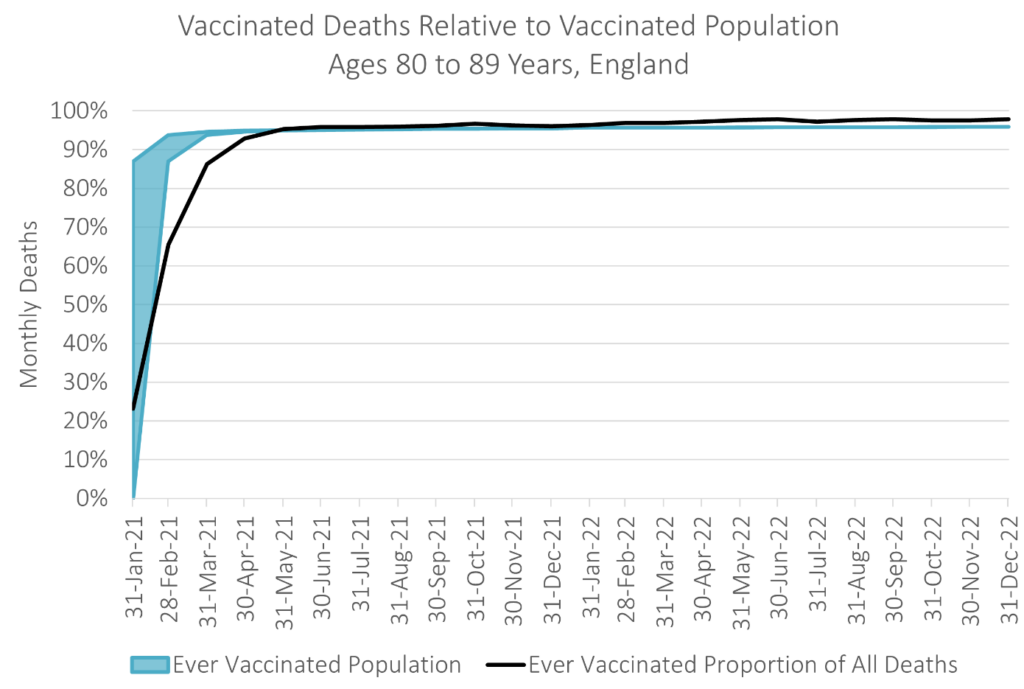
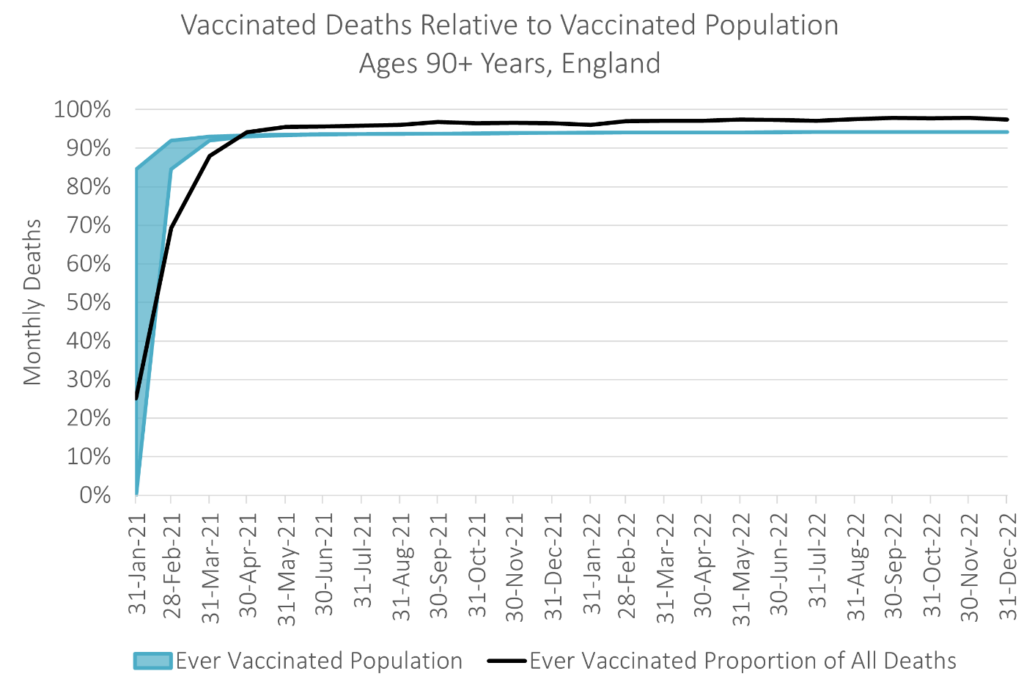
The charts showing this, produced by Joel Smalley, are reproduced below. While confounders cannot be excluded with these data, it would also be fair to say that they are hardly indicative of a protective effect, particularly given the healthy vaccinee bias which means vaccinated people are usually healthier on average than unvaccinated people.
I should note that there appear to be some serious issues with the ONS data that need to be addressed. In particular the population estimates seem very low, particularly for the unvaccinated. Linked to this, while all deaths appear to be included, the population data only include individuals registered on the census. Since the unvaccinated are less likely to be registered on the census, this will artificially increase the death rate in the unvaccinated population.
There are also some missing data which Dr. Clare Craig has pointed out to the ONS and which officials have said they will address (UPDATE: The dataset has now been corrected on these particular points). The data have also changed since the last release, with the May 2022 data point that showed parity between vaccinated and unvaccinated death rates now altered. The reason for this is unexplained though may be due to a reporting lag.
Dr. Sarah Caul from the ONS tweeted out a graph showing the age-standardised mortality rate (per 100,000 person-years) over 2021 and 2022 by vaccination status, split into Covid and non-Covid deaths.
In theory this is a very useful graph. Of course, the flaws in the data (such as skewed population estimates) mean we can’t really be sure how useful it is. But it’s still worth looking at it more closely.
Dr. Caul notes that “throughout the time series those unvaccinated had a higher age-standardised COVID-19 mortality rate than those who had had any vaccination”. She seems to be implying that this means the vaccines are benefitting people, and this is the message many have taken away. The Mail, for instance, ran a story headlined: “Death rates are NOT higher among Covid-vaccinated Brits, according to official stats debunking major anti-vaxx myth.” It claims: “Mortality levels were actually higher among the unvaccinated.”
However, that is not the correct message of these data or this chart. Rather, their main message is that the data are biased, though there does also appear to be a signal of elevated non-Covid deaths in the vaccinated.
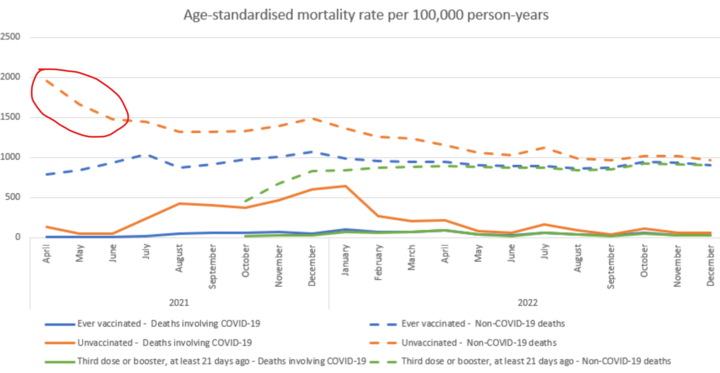
The first thing to note is that downward slope in April to June 2021 in the unvaccinated non-Covid deaths. Why were the unvaccinated dying so much of non-Covid causes in April, and why did they stop dying so much by June? There are two prime suspects for this. First, the ‘moribund unvaccinated effect’ (also known as one form of the ‘healthy vaccinee effect’) whereby those close to death are not vaccinated, temporarily elevating the death rate in the unvaccinated. Alternatively, it may be a miscategorisation issue, whereby the vaccinated who die shortly after vaccination are counted as unvaccinated. I tend to favour the former, but whichever it is, it is surely an artefact of some kind.
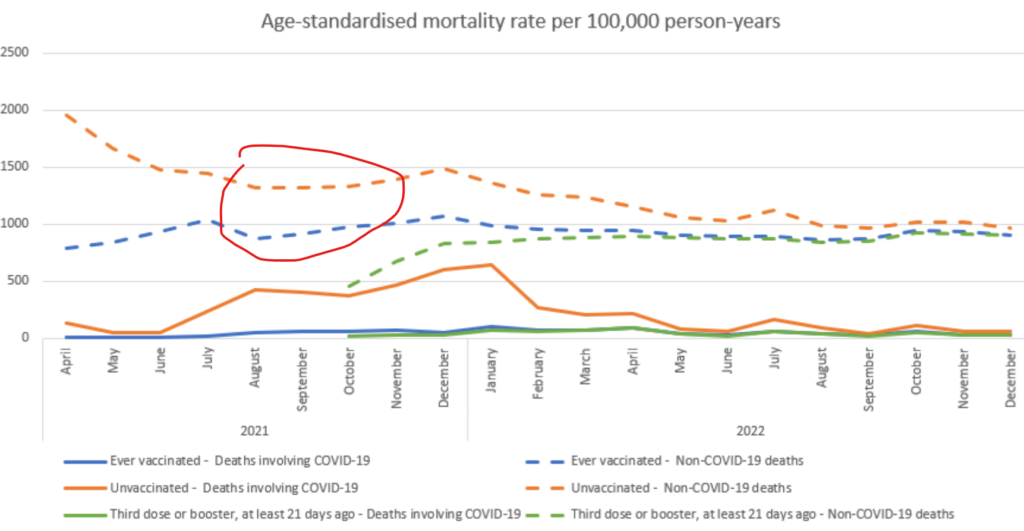
The second point to note is that once the unvaccinated non-Covid death rate stabilises in June, it remains significantly above that of the vaccinated during 2021, at around 40-50% higher. This means that the unvaccinated are dying of non-Covid causes at a rate up to 50% higher than the vaccinated. Since the vaccines cannot elevate the death rate of the unvaccinated, and assuming they are not miracle drugs that ‘cure all that ails you’, this is evidence of heavy bias. It may be a healthy vaccinee bias or a population estimate issue (as Igor Chudov argues), but once again it is an artefact confounding comparisons between vaccinated and unvaccinated. Since the gap between vaccinated and unvaccinated Covid deaths (solid orange and blue lines) is on a similar scale, this raises questions about how much of that difference is also bias.
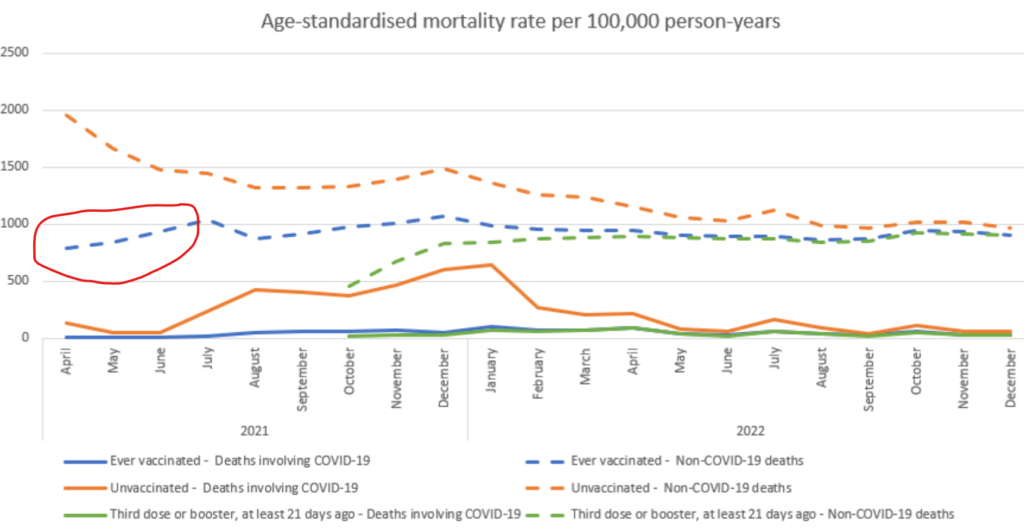
The next thing to note is that conspicuous rise in death rate in the vaccinated from non-Covid causes between April and July 2021, to around 30% higher, where it then largely remains. This is not simply the reverse of the decline in the unvaccinated death rate in the same period described above because the elderly vaccinated population is much larger than the elderly unvaccinated population by this point so the relatively few missing deaths will not have a significant impact on reducing the death rate. Instead, this seems to be a real rise in the non-Covid mortality rate of the vaccinated. This makes sense as it corresponds to when non-Covid excess deaths first rose in mid 2021. A comparison between the mortality rate in April 2021 (around 750) and April 2022 (around 950) is particularly striking. What we could do with is a baseline showing the normal mortality rate for England so we can see whether these rates are elevated compared to that, but that has not been provided.
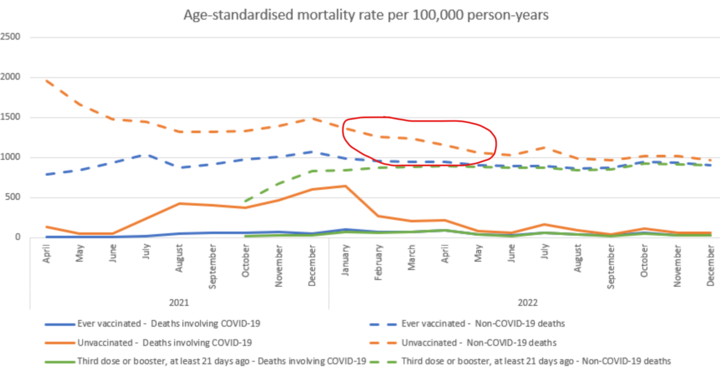
The next thing to note is the drop in the non-Covid death rate in the unvaccinated in the first half of 2022, by around 30%. Why do the unvaccinated became much less likely to die over this short period? It is not explained and I have no suggestions either, but such a huge improvement in the health of a cohort does need some kind of account; it is presumably an artefact of some kind. Responding to queries on Twitter, Dr. Caul simply stated that: “More research would be needed, [it] could be based on the characteristics of those likely to be vaccinated/unvaccinated.” After June the non-Covid death rates for vaccinated and unvaccinated become similar, but the reason they have converged – due to the vaccinated rate increasing and the unvaccinated rate mysteriously decreasing – remains under-explored.
Two further anomalies worth noting are that the July 2022 heat wave oddly seems to affect only the unvaccinated, and the sharp rise in deaths in December 2022, seen in the weekly ONS deaths data, is completely absent here, though the latter may be due to a reporting lag. Neither of these things instils confidence in the data. The fact that the chart is age-adjusted rather than split by age is also unhelpful as there are serious doubts about the suitability of the age-adjustment model for the pandemic period.
All-in-all, we are limited in what can be drawn from these data, though the rise in the vaccinated non-Covid death rate in spring 2021 seems to match the rise in excess deaths in the same period and is a possible signal of concern.
I’ll leave you, as promised, with Joel’s graphs, showing for each age bracket how the vaccinated are over-represented in all-cause deaths for much of 2021 and all of 2022. These use raw data and NIMS population data so are unaffected by some of the issues noted above.
To join in with the discussion please make a donation to The Daily Sceptic.
Profanity and abuse will be removed and may lead to a permanent ban.
A good example of them just changing the all cause mortality data up to May 2022 in the unvaccinated in this latest (2021 census) dataset relative to the last (2011 census) dataset can be seen in the 70-79 age group. They don’t make it easy to compare ever vaccinated (i.e at least one dose) with unvaxed by not providing ever vaccinated figures in table 2 of their dataset. But it can be done. See this chart. The vaccinated all cause mortality isn’t really changed at all moving into this latest dataset (apart from the final May 2022 point which will be down to late reported deaths being added in). But look how the unvaxed mortality now changes by the magic of a new ONS report to remain above the vaxed mortality during 2022 up to May 2022. Presumably the same magic applies after May 2022. Of course the high non-covid mortality in their data for the unvaccinated vs the unvaccinated has never been explained. So claiming vaxed mortality is less than unvaxed mortality can’t be done, all we can say is that there are significant inconsistencies and anomalies in the data that makes it unusable in many respects. It just… Read more »
Here’s an example of the sort of nonsensical reply you get from ONS if you ask about inconsistencies in their vax status data from this recent FOI request.
https://www.ons.gov.uk/aboutus/transparencyandgovernance/freedomofinformationfoi/changeinpopulationmeasureindeathsbyvaccinationstatusenglandpublication
Essentially ONS are claiming that a removal of 76,068 people across all age groups and all vaccination statuses (so let’s wild guess at the removal of 1,000 unvaccinated 70-79 age group in March 2021) can mainly explain a 150,000 reallocation from unvaccinated to vaccinated between the to 31st October 2021 and to 31st December 2021 datasets.
Basically they removed almost half of the 70-79 unvaccinated between these two (old) reports and moved them to vaxed status without any mention in the accompanying report. Oh but it won’t really affect mortality figures apparently!
Yes and didn’t Prof Fenton make that very point not so long ago? I’ll await his take on this latest data. I don’t understand why the ONS do this because they just end up looking like duplicitous, unprofessional fools. Do they actually think independent people with knowledge in this field won’t call them out on their sneaky ‘smoke and mirrors’ BS?
Professor Fenton’s (etal) paper based on the to 31st May 2022 data was exceptional. I’ve looked at the data very closely and it’s just spot on.
https://www.researchgate.net/publication/365202828_What_the_ONS_Mortality_Covid-19_Surveillance_Data_can_tell_us_about_Vaccine_Safety_and_Efficacy
It is quite unprofessional what the ONS are doing in my view.
There’s a lot of it about:
https://www.telegraph.co.uk/news/2023/02/21/pilot-continued-flying-co-pilot-died-cardiac-arrest-joking/ (no comments allowed).
Hmmm. I wonder why they took so long to publish the data? The data providing far more questions than answers. How…. odd. A couple of things to mention in reply to the article: 1) I’ve no idea why will thinks the “moribund unvaccinated effect” is the most likely explanation for unvaccinated dying at the same time that the vaxxed got their shot. The people with health issues were pushed to the front of the queue, not refused the jab. Seems an odd conclusion to come to. 2) I’m going to play devils advocate here. Will notes “This means that the unvaccinated are dying of non-Covid causes at a rate up to 50% higher than the vaccinated. Since the vaccines cannot elevate the death rate of the unvaccinated, and assuming they are not miracle drugs that ‘cure all that ails you’, this is plainly evidence of heavy bias.”. The Vax pushers will provide another explanation – that vaccines reduce the risk of non-covid deaths (e.g. heart failure) by reducing the impact of spike on the body. Interestingly, I’ve been getting lots of feeds to studies on the Google homepage that appear to show exactly this (had one this morning actually). If… Read more »
Yes, I too think that the “higher” number of unvaxxed deaths has little to do with unhealthy people not being poked. I wouldn’t discount it entirely, but I suspect it only plays a minor role. All the people I know, myself included, who did not get shot, did so precisely because we wished to maintain our good health. Just as I know of quite a few elderly persons in rather precarious health who have been and still are being given shots. I suspect it is more to do with when someone is counted as vaxxed. If I’m not mistaken, it is not just a matter of not being counted as vaxxed for 2 weeks after the first shot or 1 week after a subsequent shot – I think the actual count starts as of when you became infected. So if you catch the lurgy on day 14, then become ill enough for hospital 3 weeks later and then die 2 months after that, I believe you would still be counted as unvaxxed, even though you are well beyond that 2 week window. If, in addition, such an “unvaxxed” person did not take a test on day 14 but had the… Read more »
Here’s Igor’s take on the ( fake ) data;
”Be aware that the mortality per 100,000 person-years numbers are fake because ONS undercounts unvaccinated people by approximately one-half.
I am very sorry that the ONS used incorrect counts of unvaccinated people. Fortunately, we can correct them using publicly available, official UK data.
Such corrected counts of unvaccinated people lead to a much more realistic comparison of mortality between boosted and unvaccinated people, consistent with our observations of overall excess mortality in the UK.
This is NOT a harmless mistake. Undercounting unvaccinated people will distract the public from looking at the real cause of excess mortality because ONS numbers falsely suggest that the boosted people experience lower excess mortality than the unvaccinated.
The opposite is likely true: as I have shown, the boosted people have higher excess mortality. Furthermore, corrected mortality explains the 20% or so excess mortality the UK experienced in December.”
https://igorchudov.substack.com/p/ons-data-25-excess-mortality-among
There has been an ongoing significant discrepancy between the NIMS database unvaccinated percentages in the UKHSA weekly surveillance reports and the unvaccinated percentages in the ONS datasets. Most here will be aware of this.
If you make a simple switch over to the raw NIMS percentages it’s surprising how you do then see plausible figures for respective all cause mortality across age groups, once the mis-allocation errors disappear once most first vaccinations have long since occurred. I know I’ve checked it in the past.
The ONS use a NIMS extract and tie it into the 2021 census (and GP registration and 2011 census previously) so it’s surprising that there is the huge unexplained difference.
UKHSA weekly NIMS and the ONS dataset can’t plausibly both be right.
It should be possible to compare the two through sampling and determine what is wrong. Nobody seems to want to do this though as it might provide some unwanted results.
Simply nothing that spews out of the Government machine can be trusted. Nothing but a malign load of goblins.
Once you ‘tell government’ that there’s something in the data, they’ll go out and make sure that the statistical signal disappears.
I think this is why this latest ONS mortality report took so long to get published, and why its data is so very different than seen in other reports (their estimate of the unvaccinated numbers, particularly).
if you want to see data that shows things the way they are, you have to look at new data sources (ie, that TPTB haven’t realised need to be mucked about with).
They are following a political agenda and need to be closed down.
On the point about December 2022 mortality looking low:
I think we have to be careful here as the ONS dataset is based on deaths that occurred in December and were reported by 4th January 2023 and so will be missing deaths that occurred in December but weren’t reported until after 4th January 2023.
The December peak occurred in the last few weeks of December, so this has the potential to materially affect things
If the ONS provided data to show the number of days it rained last year, I wouldn’t believe it.
I prefer the evidence of my own experience. I knew one unjabbed person who died OF (not with) Covid. He was my cousin; aged 57; heavily overweight and vegetarian. I doubt he ate a very good diet.
I know / know of 20+ jabbed people who have suffered strokes, heart attacks, severe liver problems and aggressive/terminal cancers in the past 18 months. 5 have died; 2 cancer sufferers are terminal and one stroke victim is so bad she could go at any time.
Lies, damn lies and bloody statistics.
I tracked religiously the ONS weekly data of covid cases, hospitalisations and deaths.
My conclusions were that over 90% all-age deaths with Covid were Vaxed with the +70yr cohort contributed to the mass of numbers.
However, in younger cohorts, the deaths – although significantly of a lower magnitude were more 50/50. Knowing what we think we know now, I believe this was more to do with the with/of Covid diagnosis debacle than anything else.
However, the overall weekly trends show (to me) a) the Vax did not protect and b) did not stop transmission. The awareness of “safe and effective” would not be apparent until significantly later in time than week 13 2022 when the reports stopped.
‘Corrected’ version of dataset now available from ONS (tables 3 to 5 corrected)
https://www.ons.gov.uk/peoplepopulationandcommunity/birthsdeathsandmarriages/deaths/datasets/deathsbyvaccinationstatusengland
Months were mislabelled. Well, that inspires confidence.
“particularly given the healthy vaccinee bias which means vaccinated people are usually healthier on average than unvaccinated people.”
You keep saying this but I don’t see any data to back this up. Just sounds dumb to me. One could equally argue the unvaccinated are more likely to take care of themselves as they are less likely to put junk into their bodies and believe in natural immunity.
Waiting for your data on this….
This still needs to be explained:
“In summer 2021, each month 15,000 or so working-age people started a PIP claim. That monthly figure had remained little changed for years. It then steadily increased, such that by July 2022 (the latest data) it had doubled to 30,000. This report investigates the increase.”
https://ifs.org.uk/sites/default/files/2022-12/The-number-of-new-disability-claimants-has-doubled-in-a-year-IFS-report-R233.pdf
My MP has written to the Department of Health about this on my behalf. No reply as yet.
Meanwhile, in South Australia, ‘the authorities’ are desperate to keep pushing the ‘boosters’, as is occurring all around Australia, as there are Covid jab stockpiles to move, and a lucrative mRNA vaccine industry to develop…
Consider for example this article published recently on InDaily, with a striking headline: ‘Unvaxxed five times more likely to die of COVID: SA research‘. A quote:
I’m highly suspicious of this research, and contacted SAHMRI to seek more info, and received a brief summary.
However, I was advised the full report belongs to SA Health and is not SAHMRI’s to publish.
I’ve written to the South Australian Health Minister seeking more information.
But it seems to me this is ‘research to order’ to support the ongoing Covid jab program…
Here’s the info in the summary report I received from SAHMRI: COVID-19 Adverse Outcomes by Age and Vaccination Status South Australian data, August – October 2022 Prepared by Prof Caroline Miller and Prof Joshua Ross 25 January 2023 COVID-19 cases recorded in South Australia between 1 August and 31 October 2022 were analysed to ascertain the difference in likelihood of hospitalisation or death between those who had received different numbers of vaccine doses or no doses. Summary of Results The risk of adverse outcomes with COVID-19 increases with age. For all age groups, the risk of adverse outcomes decreases with vaccination, and boosters provide further protection. Among those who had COVID-19, for all age groups: • people who were not vaccinated were more likely to be hospitalised than those who had been vaccinated; • people who had received three or more doses were the least likely to be hospitalised with COVID-19; • there were very few deaths (only two) in those under 60 years of age during the dates data were analysed; and, • among those aged 80+, those who were not vaccinated were more likely die as a result of COVID-19 than those who had been vaccinated. Multivariate analyses… Read more »
I can offer a suggestion to help with one of the anomalies noted in this article.
“The next thing to note is the drop in the non-Covid death rate in the unvaccinated in the first half of 2022, by around 30%. Why do the unvaccinated became much less likely to die over this short period? It is not explained…”
Note that this drop occurs just after a wave of covid deaths in the unvaccinated. Most of the COVID deaths will have occurred amongst the elderly and infirm, especially those close to the end of their lives regardless of covid. That wave of covid deaths would have left fewer elderly and infirm people to die of other causes. A variation of the “dry tinder” effect, basically.
I beg to differ with the comment that “vaccinated people are usually healthier on average than unvaccinated people”. Well, not according to this analysis – https://childrenshealthdefense.org/wp-content/uploads/Vaxxed-Unvaxxed-Parts-I-IX-1.pdf which shows the complete opposite. Moreover, autism has rocketed from something like 1 in 10,000 to 1 in 36. Children’s natural immunity, particularly in America, is being severely compromised by a cocktail of largely unnecessary vaccines since the advent of clean water, effective sanitation and good nutrition have proved sufficient to combat diseases. People are getting sicker from all sorts of maladies as a result of these vaccines.
Important. Read this as the ONS data is hiding a death rate of 3.7 higher in vaccinated from what I can see. Glad you are questioning the data. However the massive cover-up is the use of person years. This is used in trials for drugs and only counts the time that has passed since vaccination. So unvaccinated are counted from the beginning of the study and vaccinated since they had full vaccination status. This may be useful in a vaccine trails where the measure is infection rates, but I cannot see that this is relevent here apart from a cover up. Here’s my workings Firstly how many people have had the vaccine Coronavirus and vaccination rates in people aged 18 years and over by socio-demographic characteristic, region and local authority, England – Office for National Statistics (ons.gov.uk) Total number received at least 2 vaccinations over 18 – second figure is total 18+ population Dec-22 Total Total England Persons 31939075 36500545 87.5% Total number 3 vaccination – presume this includes the above Dec-22 Total Total England Persons 27332985 36500545 74.9% unvaccinated Dec-22 Total Total England Persons 3918960 36500545 10.7% 642,510 There are 642,510… Read more »