Summer Temperatures in Canada Have Been Massively Exaggerated Since 1978
Further holes have been blown in the regularly adjusted global and local surface databases that show increasingly implausible rates of warming. The latest work from Messrs Roy Spencer and John Christy reveals that since 1978 about half of the summer night-time warming across 10 mostly metro areas of Canada was due to increased urbanisation. This urban heat effect accounted for 20% of the day-time warming produced by ‘homogenised’ temperature datasets. The two atmospheric scientists recently published similar results showing 50% less warming over 50 years across the eastern United States.
As the scientists note, the issue around correct temperature measurement is important “since rational energy policy should be based upon reality, not perception”. To the extent that global warming estimates are exaggerated, “so will be energy policy decisions”, they note. Reductions in actual warming mean “climate models become increasingly irrelevant”.
Dr. Roy Spencer and Professor John Christy both work out of the University of Alabama in Huntsville, where they compile the accurate UAH satellite monthly temperature record. This consistently shows less global warming than surface datasets, but is rarely mentioned in the mainstream media. In January, Google AdSense demonitised Spencer’s blog showing the UAH monthly records on the grounds that it contained “unreliable and harmful claims”. Professor Christy is the Alabama state climatologist, and Dr Spencer is partly funded through his office.
Their grounding-breaking work attempts to remove distortions caused by increasing urban heat, and uses human-made structure density data over 50 years supplied by the Landsat satellites. They use a dataset of urbanisation changes called ‘Built-Up’ to determine the average effect that urbanisation has had on surface temperatures. Urbanisation differences are compared to temperature differences from nearby weather stations. More detail on the methodology behind their work can be found here.
For his Canadian work, Spencer uses the Global Hourly Integrated Surface Database which provides mostly hourly readings to support aviation at airports around the world. Airports are a favoured location for surface datasets run by all the major operators, including the U.K.’s Met Office. Night and day-time urban warming results were produced from 70 weather stations scattered across Canada. The table below shows the results from the 10 stations with the “largest diagnosed spurious warming trends” from 1978 to 2022.
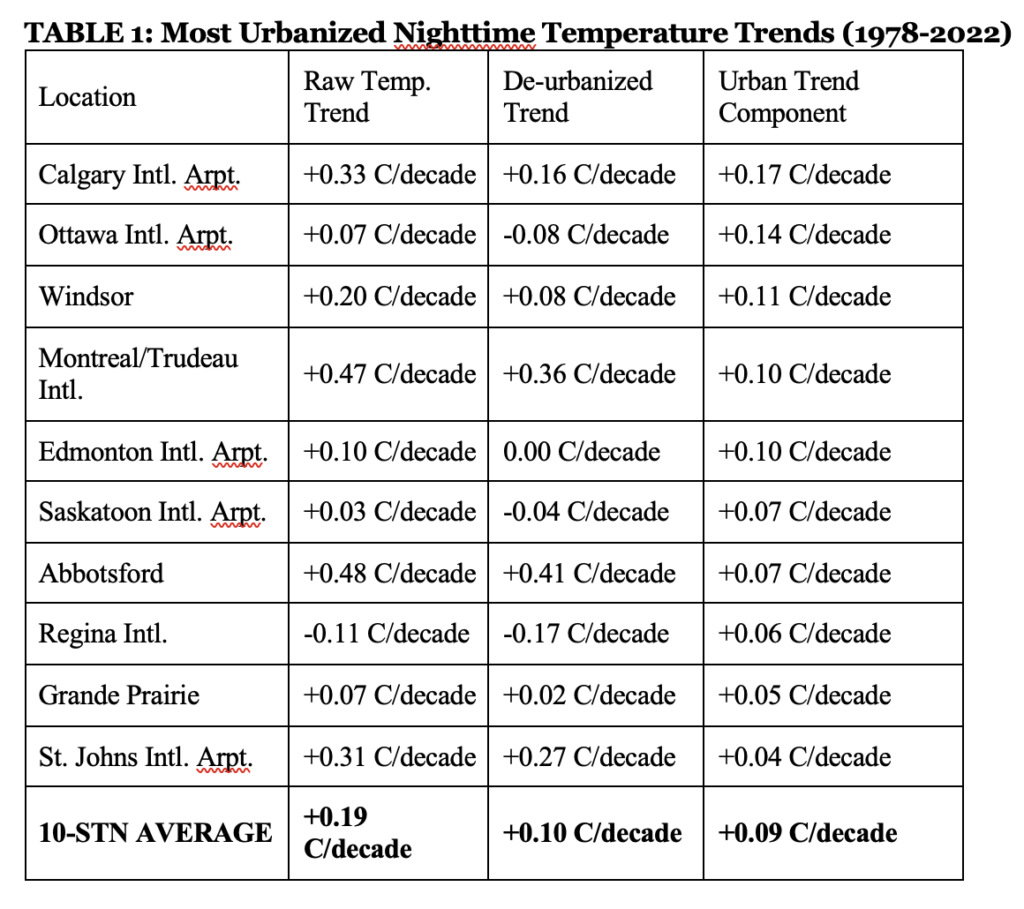
It is notable that Calgary, Ottawa, Windsor, Montreal and Edmonton are the five station locations with the greatest rate of increased urbanisation since the 1970s as measured by Landsat, and therefore the highest rate of spurious warming. Over the 10 highest growth locations shown, “48% of the average warming trend is estimated to be due to urbanisation alone”.
The day-time results are shown below:
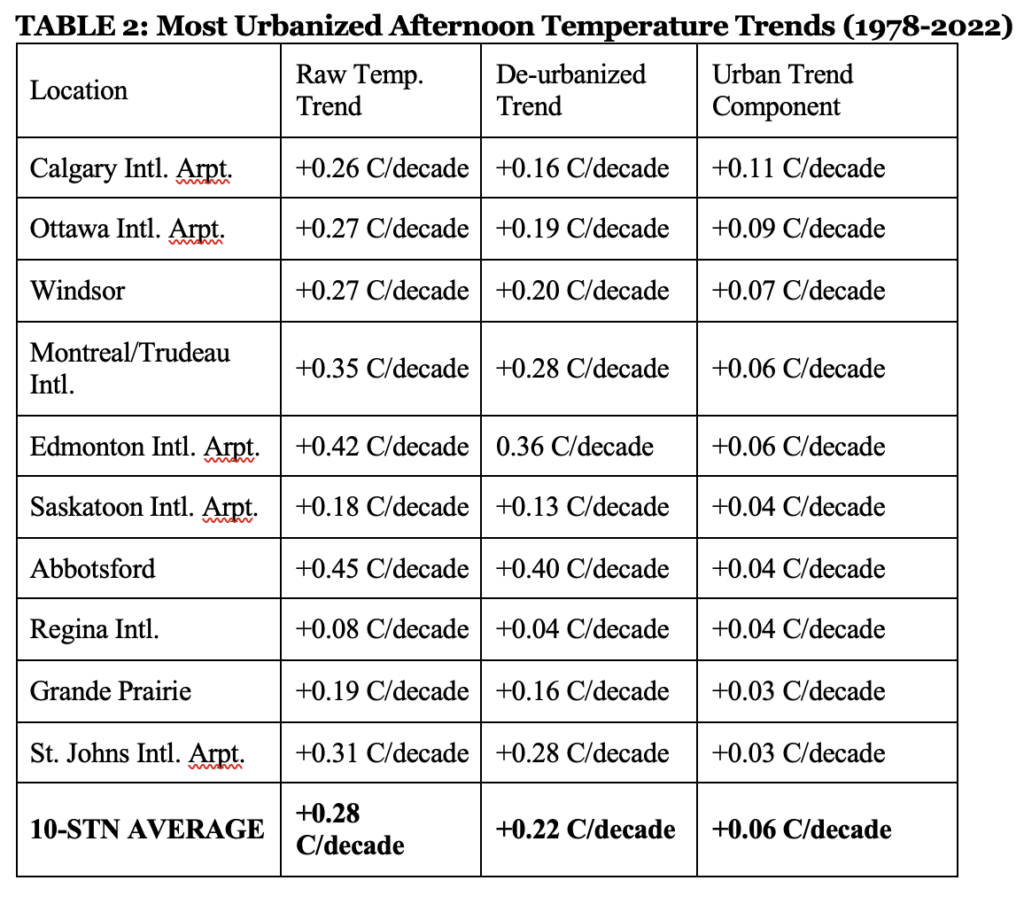
For the 10 most increasingly urbanised stations, the average reduction in the observed afternoon warming trend is 20%. The scientists note, as do many others, that the urban heat effect on temperatures is larger detectable at night when solar energy absorbed by heat-retaining building material is slowly released.
This work is part of an ongoing investigation by Spencer and Christy into the degree to which surface temperature datasets are producing warming trends that have been exaggerated by increased urbanisation. Preliminary analysis has also been done for the U.K., France, Australia and China. It seems the more work they do, the more critical they become of the surface datasets. Current ‘homogenisation’ techniques for thermometer data adjustments do not explicitly attempt to correct urban trends to match rural ones, they point out. Instead, it appears the reverse occurs. The work of the U.S. meteorologist Anthony Watts is referenced. He found that the U.S. homogenised dataset produced temperature trends “as large as those produced by the stations with the worst siting in terms of spurious heat sources”.
The scientists also refer to a rarely-publicised dataset compiled by the U.S. weather service NOAA from 114 nationwide stations designed to provide recordings away from urban heat distortions. The measurements started in 2005, and to date show little if any warming across the U.S.
Spencer and Christy’s vital work will continue and the Daily Sceptic will carry on reporting their findings. Of course, the mainstream media will ignore the story, presumably on the grounds that these facts don’t fit a pre-determined Net Zero ‘settled’ science narrative – or sick their ‘fact-checkers’ on to us for daring to report it. Meanwhile, the compilers of the corrupted, but politically-correct, temperature figures will continue to declare new global warming records.
Chris Morrison is the Daily Sceptic’s Environment Editor.
To join in with the discussion please make a donation to The Daily Sceptic.
Profanity and abuse will be removed and may lead to a permanent ban.
That’s actually my (completely unscientific) pet theory as well: An increase in an averaged temperature doesn’t mean it got warmer everywhere, just that it got warmer somewhere, with somewhere being temperature measurement stations increasingly being located close to sources of localized ambient heat.
For a somewhat silly example why this doesn’t matter: Assume you’re sleeping in an otherwise unheated room with an open garden door below a layer of three blankets in late November (this matching my usual situation during the night ATM). A thermometer placed below the blankets layer would record a pretty cosy temperature. But this will not stop the remainder of the room from becoming pretty cold over night. Hence, averaging the reading of the mentioned thermometer with another sitting in a different location in the same flat will not accurately represent actual room temperature.
Exactly.
Let’s put all our thermometers in the Arctic and see where that sends the stupid averages.
Another example: in the summer my heat-trap patio will often read 34 – 38 degrees on a ‘normal’ hot summer day (lush!) while the ambient temp in my old stone house will be around 16 – 18 and has never in living memory gone above 24, even during the fabled 40. Zeroistas will be salivating at the patio temp, while needing a light sweater indoors. Bonkers.
It is even worse than this. Those scary temperature charts that show temperatures around the world are calculated from ground station readings and grids are used to help the presentation. The grids are based on squares of typically between 220 and 550 km per side (one dimension decreases towards the pole) according to which organisation is doing the sums.
A temperature is assigned to each vertex, but in areas where measuring stations are few and far between, like the Arctic, Antarctic and all oceans, temperatures are interpolated.
Once they have been guessed at they are then assigned the status of data and become part of the climate sausage machine.
I am sure those of you that inhabit the UK listen to weather forecasts from all over the country, and you may well work out that temperatures vary quite a bit over 220km and even more over 550km, and also that there is rarely a smooth change from one place to another. Interpolating mid ocean temperatures from stations sited on the coasts of two separate continents give scope for a lot more inaccuracy.
Which is why in my view the satellite temperature record is likely to be the most accurate.
Anthony Watts has done some great work on these measurements for the US weather stations. He hasn’t finished yet but he, and his colleagues, are literally going around to each one and documenting them. What he has found so far mirrors the Canadian results.
(147) Bombshell Report: 96% of U.S. Climate Data Is Corrupted – YouTube
Measuring the Earth’s Global Average Temperature is a Scientific and Objective Process – Everything Climate
When Christy and Spencer retire who is going to challenge the pretend to save the planet consensus? Even with these people still working on this issue most ordinary people will never have heard of them or any other work that does not comply with the current highly politicised orthodoxy. Most people simply accept there is dangerous warming and allow bureaucrats to interfere in all aspects of their life to keep the “temperature of the earth” (whatever that is supposed to mean) down. It is hard for ordinary people busy with work and family life to have time to investigate issues like this and they assume that investigative journalists are doing that on their behalf………How wrong they are.