Is There an ‘Excess Deaths Crisis’ in England?
It’s been widely reported that England is in the throes of an ‘excess deaths crisis’. We’ve covered it here at the Daily Sceptic, and so have many other outlets.
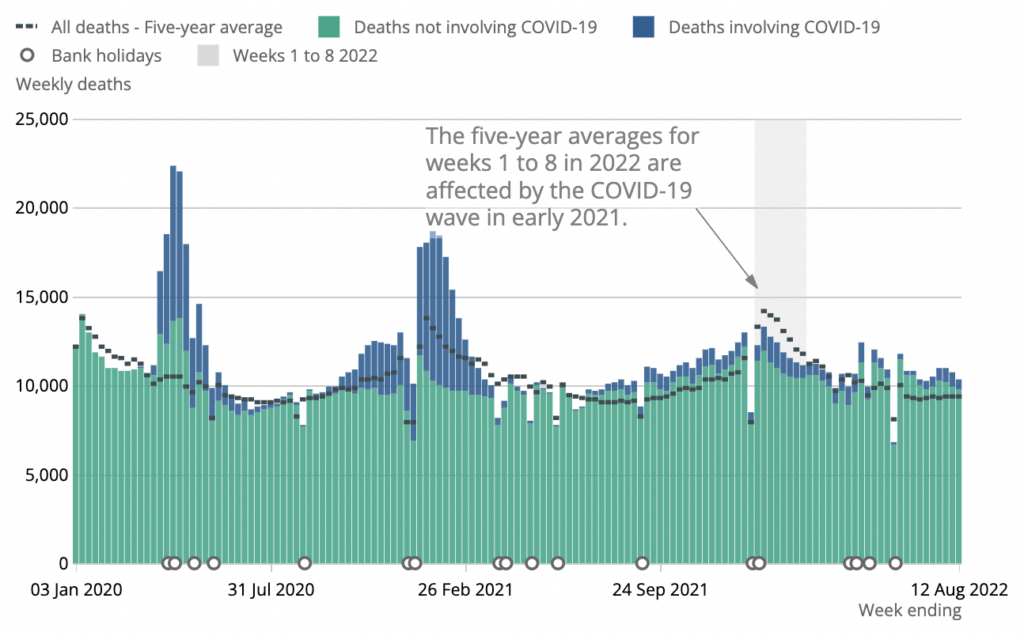
According to figures published by the ONS, England and Wales has seen over 17,000 excess deaths since the start of May – which is 12% higher than the five-year average. What’s more, only 7,600 of these can be attributed to Covid. And that’s if you generously assume that every “death involving Covid” qualifies as such.
Lockdown sceptics (such as my colleagues Toby and Will) have suggested the excess deaths we’re seeing might be due to the delayed effects of lockdown. For example, perhaps more people are dying now because of missed cancer screenings back in 2020. They’ve also suggested that adverse reactions to the vaccines might be playing a role.
However, I’m not sure there’s really anything to explain. The chart below shows age-adjusted excess mortality in England since January of 2020. It is based on data published by the ONS.
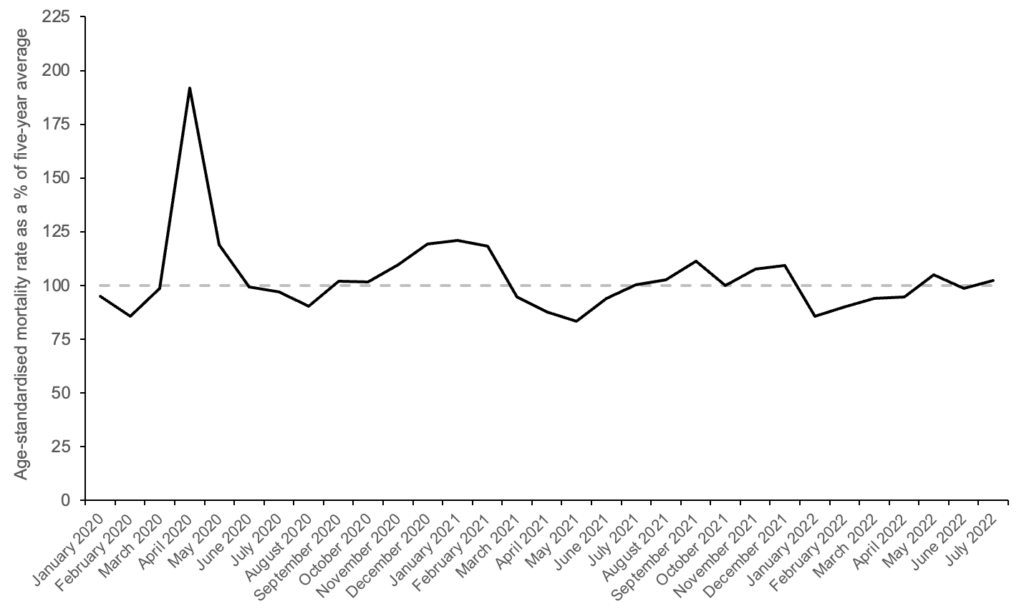
As you can see, there was a big spike corresponding to the first wave and a small hump corresponding to the second wave. Since the start of 2021, however, we haven’t really had any excess mortality – at least on average. Zooming in on the last three months (data for August are not yet available) there’s nothing to report.
Age-adjusted mortality was 4.9% higher than the five-year average in May, was 1.2% lower in June, and was 2.2% higher in July. Averaging across the three months, it was only 2% higher than the five-year average. To put this figure into perspective, age-adjusted mortality was *92%* higher than the five-year average in April of 2020.
So what explains the difference between my chart and the one above? Two things: choice of baseline, and age-standardisation (plus the chart above includes Wales).
My chart uses ‘2015–2019’ as the five-year average. By contrast, the ONS recently switched to using ‘2016–2019 plus 2021’ as the five-year average. The latter time period omits the year 2015, which had unusually high mortality. As a result, the average of ‘2016–2019 plus 2021’ yields a lower baseline than the average of ‘2015–2019’, which has the effect of exaggerating excess morality.
A more important difference is age-standardisation. My chart plots the age-standardised mortality rate as a percentage of the five-year average, whereas the chart above compares the absolute number of deaths to the five-year average.
Because England’s population is ageing, the absolute number of deaths is increasing each year – or has been since 2011. This means that the five-year average underestimates the expected number of deaths in the year of interest. (Earlier in the pandemic, lack of age-adjustment led pro-lockdown commentators to overestimate the number of deaths caused by Covid.)
Incidentally, John-Burn Murdoch at the Financial Times correctly notes that excess mortality is much lower once you adjust for age, though for some reason he still finds an elevated level in July. (This may be because he used ‘2016–2019 plus 2021’ as the five-year average, rather than ‘2015–2019’ like me.)
Two caveats are in order. First, age-adjusted mortality data for August are not yet available, and they may show a greater uptick. Second, it’s possible that people are dying from the delayed effects of lockdown, but this isn’t showing up as age-adjusted excess mortality because the five-year average is the wrong counterfactual.
In other words, it’s possible we’d now be seeing negative excess mortality (i.e., ‘mortality displacement’) if not for the delayed effects of lockdown. This is by no means implausible, as there has been considerable mortality displacement in Sweden – which didn’t lock down.
However, going by the conventional way of doing things, there’s currently no ‘excess deaths crisis’ in England.
To join in with the discussion please make a donation to The Daily Sceptic.
Profanity and abuse will be removed and may lead to a permanent ban.
I agree with this “counter-scepticism”, up at least to the point of advising caution about falling victim to “confirmatory bias”, which in the present context is mainly unconscious bias towards selecting data, or ways of analysing and interpreting data, which supports the preconceived agenda, or cannot refute it. However, there still remains the issue of what, if anything, is causing the excess deaths, or even the anticipated deaths, and seeing if there is a change in pattern, such as a shift towards the factors that in the frame: delayed cancer/heart, mental health (especially with the forthcoming poverty hit) and adverse vaccine effects.
I’ve spent some time today considering the attempt to discredit John Campbell who did this report on excess deaths. As often is the case with Dr Campbell, he merely reports the figures and simply says that the situation needs further investigation.
(133) Excess deaths, the data – YouTube
But reading this article on DS does highlight the age old lies, damn lies and statistics issue in that you can cut & dice data in many ways.
It looks like Campbell is using ONS data? But my question about the baseline point raised here – I doubt this is a problem globally and only the ONS data is debatable. So a baseline debate doesn’t explain the increase in excess deaths on other countries?
I haven’t watched his video, but am keeping a spreadsheet of the last 10 years of ons data for England and Wales. There’s two adjustments to make to the raw numbers that push the older figures upwards: increasing population and aging population.
With those done, we have been about 10% over the pre coof mean. Maybe more unusually, the standard deviation has been much more off beam, because summer deaths are much more stable than winter. We were up by 7 sd one week. Now down to +4. +7 was as out of normal as anything except the first covid wave
Isn’t the point about excess death is it is occurring mostly in the younger age groups?
Yes it is which is the worrying part of it all but then again, the idea of giving an experimental vaccine with no real long term data that went through a compressed trial to young adults and children has always horrified me.
The German data below highlights that something is harming younger adults but not the elderly so that cannot be the COVID virus as its effects are completely the other way around.
Isn’t it important to look at the age stratification of the excess deaths, rather than simply the age-adjusted and age-standardized numbers? Unless I’m misunderstanding how these numbers work, I think I’m right in saying that they compare deaths to the overall age of the population rather than revealing anything about unusual death spikes in younger age groups.
I think it’s logical that a lot of deaths of older people were pulled forward by Covid mortality in 2020 and 2021, so you would surely expect a reduction in excess deaths in the following years. The important question is: are there significant excess deaths in younger age groups and reduced excess deaths in older age groups? If that is the case, then the underlying causes of these excess younger deaths should be aggressively investigated.
I read an article on one of the many sources that made a comment about this. Let me see if I can find it!
Found it:
Exhaustive study of German mortality data finds excess deaths tightly correlated with mass vaccination
Exhaustive study of German mortality data finds excess deaths tightly correlated with mass vaccination (eugyppius.com)
This comment caught my eye:
That is my understanding too together with what is causing these which appears to be largely ‘sudden death syndrome’, or ‘unknown cause’.
Plenty of unexplained deaths from heart conditions in normally healthy young people.
I guess it’s down to who or what you believe. I watched the John Campbell video & thought he seemed quite hesitant in places with his presentation. Maybe knew he would be attacked for it? However, there are also people like Carl Heneghan & Tom Jefferson who believe the stats around excess deaths are real. Who knows? Sometimes I think we’ve slipped into some sort of alternative reality. Maybe its all due to the Great Hadron Collider (says he semi-jokingly).
https://trusttheevidence.substack.com/p/update-on-excess-deaths
As I alluded to above, as Campbell has changed to a bit of a sceptic, he’s now becoming a target for cancellation which having watch many of his videos, I suspect he finds slightly amusing or perplexing. He is making money out of his YouTube channel which the attackers are using to suggest he’s become more anti-narrative to make £££. A rather cynical POV but entirely possible – although I prefer to believe he’s changed his mind because he does follow the data and needs to question it. The £££ will be an added bonus. Rather hypocritical to criticise somebody making money out of the situation when pharma is making billions.
Maybe he’s aware that he risks cancellation by YouTube/pro-narrative if he blatantly said that the vaccine could be part of the problem.
Independent of what the truth is, it’s sad once again that the response is to cancel/censor.
It would be interesting to see how this breaks down by age group. An allegation frequently made is that we’re seeing more deaths in young and working age people since the role-out of the COVID jabs. For example the analysis of Edward Dowd in the US, working with life insurance claims. This might not be apparent from whole population death rates, particularly if it be offset by lower deaths amongst the elderly with fewer of them owing to the effects of lockdowns and Midazolam in 2020/2021.
I think only an age stratified analysis will show you the real problem. If the excess deaths in 2020 and the wave in 2021 January are situated around the 80 years old group and the recent excess deaths are found in lower age cohorts (working age 20-60 and teens) then I think the data will indeed be shocking and we will be forced to look at the jab effects.
Try this… https://www(dot)eugyppius(dot)com/p/exhaustive-study-of-german-mortality
Great article. Very interesting perspective. Another splendid example of how balanced this site is; a stand out example for so much of the rest of the fourth estate. Thank you.
As Sceptics we’re in search of the truth, so should welcome contrarian views such as this.
As someone who hasn’t got the time to do this analysis myself, I’m reliant on the views of others. But when people like Carl Heneghan and our own Will Jones say there is excess mortality, who am I to believe?
I wonder if Will might pen a reply piece?
And to think we’ve always been told that excess mortality is a figure that can’t be massaged and is hard to misinterpret,
“And to think we’ve always been told that excess mortality is a figure that can’t be massaged and is hard to misinterpret,”
Well the total number of deaths and their ages is pretty hard to massage at least in what used to pass as “liberal democracies”. What’s fuzzier is what counts as “excess”. It depends what baseline you pick and whether you believe in age-standardisation or not. Death rates fluctuate for reasons that are probably not understood. The “excess” deaths we are seeing now (if they are indeed “excess”) are arguably fairly insignificant in historical terms, just as the “excess” deaths during “covid” were. The difference IMO is the vaccines. “Covid” was unavoidable, the “vaccines” are not. So I think it needs to be looked into, and as the “vaccines” are useless and there’s no emergency to justify their authorisation, they should be withdrawn immediately pending further safety checks.
A key thing to look at IMO is, as people have pointed out above, the age bands of this “excess mortality”. If it’s affecting younger cohorts and the factor by which it is varying is unusual then that’s a red flag.
There would have been no point in jabbing people if the intention weren’t to cause “excess” deaths. And, of course, infertility.
But causing lots of excess deaths soon after jabbing would be counterproductive as even people stupid enough to let themselves be jabbed might notice what was happening.
So I suspect that the total number of people currently being offed by the jabs isn’t as great as the biggest sceptics fear, but is big enough in the younger age groups to constitute a harbinger.
I think we need to get Prof Norman Fenton’s perspective on this and whatever his final analysis is I’ll go with.
Will pull this link out into it’s own thread as many are asking questions about age variation. German data but it is by age:
Exhaustive study of German mortality data finds excess deaths tightly correlated with mass vaccination (eugyppius.com)
Refreshing to see a publication with real integrity trying to look at the data objectively rather than just pushing a single point of view. Bravo!
Excess mortality has been written about extensively on Joel Smalley’s substack site. Hope you have a chance to read his findings.
We now know so many dead from cancers, that were in remission for years. Or new cancers, spread throughout body, stage 4. The alarming “sudden death” events in the 20 to 40 year old age bracket cannot be ignored. The death of 30 doctors recently in Canada cannot be ignored (all vaxxed).
Cdc VAERS now showing 30,000 deaths post vaxx with a possible underreporting factor of 41.
1 of Several
In my opinion this is a very important discussion. If you bear with me it should make it clear that, while Noah is correct in his observation, the situation is still very worrying and that the issues need to be understood. There are significant issue for the younger age groups.
Clearly the Age Standardised Mortality Rate (ASMR) reports published monthly by the ONS are much less alarming than the weekly death reports. They have been throughout the pandemic but don’t have the journalistic “kerb appeal” of the various weekly death totalisers.
See the attached graph from the ONS (in which I have gratuitously highlighted my birth year 1958). It may explain why I wasn’t terrified by a mortality rate in 2020 which was lower than every year prior to 2009!
2 of Several
We have had two more years (!) since then the last data point in the previous graph to get used to COVID. Re-expressing the monthly reports as annual summer-to-summer flu season reinforces the view that overall mortality has been unexceptional – despite the peaks that occurred.
Although the annual mortality numbers are genuinely “unexceptional”. It is important to remember how alarming the peaks – particularly the first one – were.
3 of Several
I freely admit my alarm. Like everyone else I had time on my hands and started looking at the weekly data in detail. It was immediately obvious (to me) that death numbers have been steadily rising for some time and that any attempt to compare unadjusted numbers with past averages would tend to exaggerate excess deaths. However, because the peak weekly number of over 20,000 in the spring of 2020 dwarfed this effect, the impact of comparing death numbers with past averages only became apparent later. I did note that the ONS were always very(!) careful to state their assumptions (“deaths were xxx greater than the 5 year average”). They knew what they were saying, even if no one else did, and they continued to produce the corrected ASMRs on a monthly basis.
4 of Several
Anyway, it is clearly possible to make the correction to the weekly data (if the ONS can do it monthly I can do it weekly). The ONS have chosen not to do so. The arithmetic is fairly simple it (take population estimates – which the ONS publish – and use these to create mortality data as the basis for creating a population/age profile corrected forecast for expected deaths.). The results are very interesting.
The uncorrected version (v average death numbers) shows the high levels of current excess deaths referred to by Noah, the version corrected for population growth and age profile (v average mortality) shows a much lower level of excess deaths at the the whole population level.
5 of Several
The previous graphs are incredibly rich graph – I invite questions – but I don’t want it to distract from what follows so I will just dive into the question of whether we should be alarmed by the current level of excess deaths – even after correcting for population growth and age profile.
We need to separate out the age groups to see what is going on.
The attached waterfall charts show cumulative excess deaths for two “younger” age groups since the pre-pandemic period. I am certainly alarmed.
There is no visible evidence of mortality displacement (lower than normal death numbers following high death numbers) so the total life years lost could be as much as a million (23000 excess deaths x 40 years). A particular cause for concern is that the excess amongst those aged 15-44 only started to grow significantly after vaccination. I know correlation doesn’t prove causation…but surely there is a question here that demands an answer?
6 of Several The picture for the elderly is quite different – there is huge evidence of mortality displacement in the data. In my view this should include the question of whether the low death rates (following two mild flu seasons) in the two years prior to the onset of the pandemic in spring 2020 was a contributor to the high death toll. The so called “dry tinder” hypothesis has been much talked about in the context of Sweden but is underexplored for the UK. However, I don’t doubt for a moment that the huge spike in death numbers for these age groups in the spring of 2020 was caused by COVID. What I do question is whether the impact in terms of life years lost is significant enough to justify the pain we continue to go through. The “dry tinder” hypothesis is controversial but ignoring it still leaves c26,000 excess deaths since the onset of the pandemic. Given the high level of mortality displacement shown life years lost is much less than for the younger age groups identified above – perhaps 75,000 (3 years x 26000 excess deaths – I think it is less). So the life years lost… Read more »
Final of Several
I have cut & pasted / condensed this multiple post from another document and hadn’t realised I wouldn’t be able to edit the grammatical & style issues. Apologies for that – I dont think it detracts from the content though. Sorry.
Excess death calculation, as Noah points out, is frought with difficulty. Method, choice of baseline period are only two of the issues. While there is no “one right way” it seems reasonable that what should interest us is the mortality rate AND the impact in terms of live years lost rather than some comparison with a population and age profile that is unrepresentative of current reality.
Some random numbers:-
So you either adjust for population (and all that this implies) or you don’t and accept 1000, largely younger, people dying every week.
You couldn’t make it up