Weekly Deaths in England and Wales Now Lowest Since 2014
There were 10,311 deaths registered in England and Wales during the week ending March 19th. The weekly number of deaths was below the five-year average in both nations, as this chart from the ONS indicates:
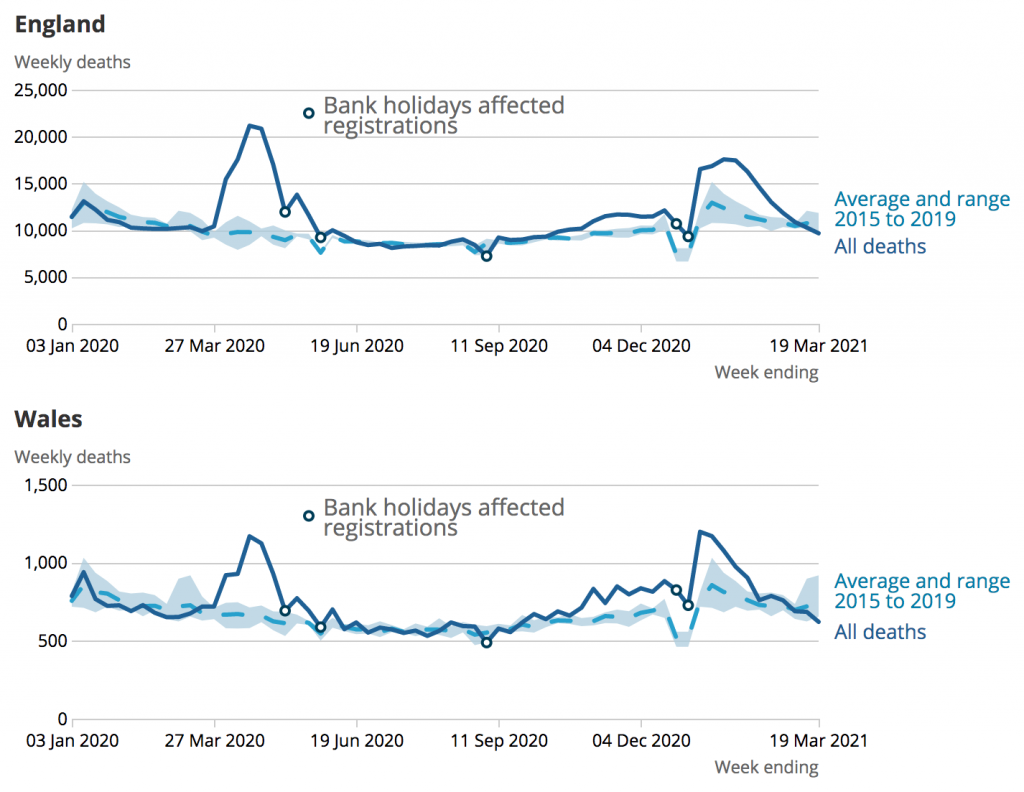
In a piece for The Observer, David Spiegelhalter and Anthony Masters note that 10,311 deaths is the lowest figure since 2014 for the same week (i.e., the week ending on or around March 19th). This is noteworthy, given that the number of deaths in England and Wales has been trending upward since 2011, due to population ageing (the increase in the number of people in the oldest age-groups).
The authors suggest several reasons why the number of deaths is so low at the moment. First, the weather is fairly mild. Second, because of the lockdown, there are fewer road accidents than usual (though this is a minor contributor).
Third, there are fewer flu deaths than usual: the influenza virus is less infectious than SARS-CoV-2 (it has a lower reproduction number) meaning that lockdowns and social distancing have resulted in fewer people catching flu this year. Fourth, some of the people who would have died now sadly lost their lives in the spring of 2020 or the winter of 2020-21 instead. (One could say their deaths were “brought forward” by the pandemic.)
Spiegelhalter and Masters’ article is worth reading in full.
To join in with the discussion please make a donation to The Daily Sceptic.
Profanity and abuse will be removed and may lead to a permanent ban.
maybe the elderly frail who should be reaching end of life now have already passed a few weeks ago – after their first vaccine that their frail bodies could not cope with – the ‘coincidence’ deaths that were likely labelled covid at the time
Indeed.
The vulnerable elderly have been bumped off early, saving care and pension costs for the government.
Not that I’d suggest that was the reason for government policy or anything…
That bumping off has cost a lot more £billions than their care and pensions would have. It’s the future bumping off that’s the policy.
You are totally right about age profile.
Average annual deaths 2015-19 were around 530,000 in England and Wales. Correcting for age profile and population suggests an equivalent figure for 2020 of around 560,000 would provide a better comparison. It would be even higher if you excluded the unusually low mortality 2019 from the calculation.
In effect they are understating expected deaths and overstating excess deaths.
I have no idea why the ONS don’t correct this in their weekly report (the airthmetic is easy with a spreadsheet I have done it). They do produce population corrected monthly reports but these don’t have the same immediacy and they relate it to a 2013 population profile rather than 2020 or 2021.
Deaths werent just brought forward there was also a considerable amount of frail elderly alive when COVID hit in the spring who might ordinarily have been expected to perish in the previous couple of years.
Look at the chart of cumulative excess deaths shown in the chart in my upcoming reply to myself.
graph as promised
65-74
“This is noteworthy, given that the number of deaths in England and Wales has been trending upward since 2011, due to population ageing (the increase in the number of people in the oldest age-groups).”
I do wish that this knee-jerk assumption was examined more carefully. The implied corollary falls into the same category as “My mate died from Corona – it’s a deadly disease.” There’s a lot of things going on in the dynamics of age structure and mortality.
Yes. But I dont think I am making a knee jerk reaction. I have looked at this data in detail over several months and have come to the conclusion that comparisons with historical averages obscure key messages the data which can be revealed by looking at normalised death numbers or mortality. Since it is arithmetically easy to make the correction (statistics for death numbers & population are available by age cohort and by sex. from the ONS) it is surely worth doing. The analysis is revealing. I attach the graphs for u65 and (in follow up post) 65-74 as well as the one for the over 75 already shown. Note the axis scales are different. I believe the data suggests the following points are worth discussing:- •There has obviously been a serious epidemic but there are genuine issues with the numbers:- •Cumulative excess deaths in the two older age cohorts during the epidemic are substantially less than reported COVID deaths. Probably less than half after adjusting for the unkonown number of collateral deaths. Why is this? Misattribution? Any other ideas? Why don’t we have a credible government estimate for collateral deaths? •The data is supportive of the “dry tinder” hypothesis… Read more »
“I dont think I am making a knee jerk reaction.”
I wasn’t aiming the remark at you. There are certain taken-for-granted assumptions in this area (‘excess’ deaths is another) that introduce modelling assumptions into descriptive analysis without flagging up that this is what they are.
I reckon straightforward population adjustment remains the only correction that keeps the data pure, although age-adjustment can be presented alongside as a hypothesis.
Influenza is being recategorised as covid19, that is why the numbers are lower. As is pnuemonia, yet of course almost everyone who ‘dies with’ covid actually dies of pnuemonia.
You can’t believe one of these statistics. The ONS has lost its credibility. By the way its also now producing equally as useless and invented ( sorry, ‘modelled’) numbers in the economic sphere. So when you read GDP or ‘average wage’ numbers, they are also a crock of smelly stuff.
“Influenza is being recategorised as covid19 …”
This is quite likely, but we don’t know – because of the shit-show that is the data. That’s why all-cause mortality is the only reasonably reliable measure.
The seasons are changing – the climate is getting milder and warmer – coronavirus cases/deaths start falling … just like all seasonal viruses do I suppose and have done since humans have inhabited the earth. And like influenza and the cold virus it will no doubt return once again the following winter in a different form (variant) in an attempt to by-pass our alert immune systems and the battle will commence once again … as it has done for a milllions of years.
In my opinion hysteria has crashed the economy and destroyed the nations psyche not the virus. In fact future historians will look back at 2020/21 scratch their heads in complete bewilderment and think to themselves .. wtf happened there?
Let’s hope so because your scenario suggests that common sense eventually prevailed.
Never trusted Spiegelhalter.Sometimes say sensible things but too many idiotic thing like that less flu deaths due to LD/SD.According to surveillance data no influenza in Europe but now evidence of return of the old corona viruses and of course the ever returning rhinoviruses. This maybe the first signs of C-19 becoming endemic.Of course the flu virus will reappear it is already in Africa and South East Asia.It will come when there is season for it.
As we are in 2021 now, if the ONS is going to use the average of the last 5 years to compare current figures with (which is best with problems in itself), shouldn’t they now be including 2020 data in their 5-year-average comparison figures? As with everything else, all “normal” rules have gone out the window in this post-covid, post-truth world. Like the way they failed to reset the covid death counter to zero after a year, like they do with flu deaths. It’s all a smokescreen, a tactic for manipulating the population into believing whatever lie they want to push.
Important article since it highlights significant anomalies in the Government narrative. If you are interested in joining an effort to create a new University, focused on rational argument, please email learningholidays@protonmail.com Can then arrange a time for a chat.