How Many Excess Deaths Are Due to COVID-19?
One of the stats most commonly latched on to by lockdown sceptics is the number of people who would normally be dying at this time of year in the absence of coronavirus because it seems to show there’s been no increase (or, rather, it did before the death toll began to peak). According to the ONS, deaths mentioning COVID-19, influenza or pneumonia in Week 13 of 2020 (March 20th – 27th) were 18.8% of all deaths, whereas the five year average puts deaths mentioning influenza or pneumonia at 19.6% of the total. Having said that, the total number of deaths in Week 13 this year in England and Wales was 11,141 compared to the five year average for Week 13 of 10,130 (ONS). (Lockdown began on March 23rd so the fact that deaths from COVID-19 weren’t higher can’t be attributed to that.)
Every year, about 600,000 people die in the UK and it remains to be seen whether more people will die this year than in a normal year and what effect, if any, the lockdown will have had. For instance, about 10% of people aged 80 and over die every year and while it’s true there’s a risk they’ll die if infected with coronavirus, they won’t be significantly less likely to die if they don’t catch it because they’re likely to die of something else. According to Prof Sir David Spiegelhalter, a statistician at Cambridge University: “Many people who die of COVID would have died anyway within a short period.” (Neil Ferguson told the FT at the beginning April he thought it was “plausible” that two-thirds of the people who died of the virus at that point would have died anyway later in the year.) The average age of the people who’ve died from coronavirus in the UK so far is 79.5 and a majority of them have underlying health conditions.
However, as the death toll in England and Wales has increased, this argument has become harder to make. According to the European Monitoring Excess Mortality group, which publishes weekly bulletins of the all-cause mortality levels in up to 24 European countries or regions of countries, the number of people dying in England was normal up until Week 11 of this year, but had climbed to “very high”, i.e. well above average, by Week 14. (Although still normal in the rUK.) And, of course, if it drops back down to normal the advocates of a prolonged lockdown will attribute that to the extreme social distancing measures the Government has imposed. Against that, the mortality rate was normal in Sweden in Week 14 in spite of Sweden not closing restaurants, bars or schools or banning social gatherings of less than 50 people. On April 12th, Sweden recorded just 17 new deaths from COVID-19, its lowest daily rise in a fortnight.
One complicating factor is that we don’t know how many people are dying of coronavirus, as opposed to with coronavirus. In the UK, if a patient with COVID-19 dies their death is automatically included in the NHS’s statistics. (The ONS’s record of deaths due to coronavirus includes those who’ve died outside hospital where the patient’s doctor suspects they were suffering from the virus, test or no test.) But what if COVID-19 in’t the cause of death? For instance, an 18-year-old in Coventry tested positive the day before he died and was widely reported as being the youngest victim at the time. But the hospital subsequently released a statement saying his death had been due to another “significant” health condition and wasn’t connected to the virus.
Dr John Lee, a retired professor of pathology and former NHS consultant pathologist, has written a piece for the Spectator pointing out that if someone dies of a respiratory infection in the UK, the specific cause of the infection isn’t normally recorded unless the illness is a ‘notifiable’ disease. Until coronavirus came along, the vast majority of respiratory deaths in the UK were recorded as due to bronchopneumonia, pneumonia, old age, etc. “We don’t really test for flu, or other seasonal infections,” he wrote. “If the patient has, say, cancer, motor neurone disease or another serious disease, this will be recorded as the cause of death, even if the final illness was a respiratory infection. This means UK certifications normally under-record deaths due to respiratory infections.”
Since March 5th the list of ‘notifiable’ diseases has been updated to include COVID-19 but not flu, so anyone now dying of a respiratory infection who’s tested positive is recorded as having died of coronavirus. But is that the real cause of death? It’s possible (although unlikely) that the UK is suffering from an above average number of deaths in April due to an unusually deadly bout of seasonal flu, not coronavirus. According to estimates produced by Public Health England, 28,330 people died from influenza in England in 2014/15 (although only 1,692 in 2018/19).
Another complicating factor is that the lockdown is likely to be suppressing other causes of death, such as road traffic accidents, workplace accidents, violent crime, etc – another reason the number of deaths may not be much above the five-year average since the lockdown was imposed. That is, deaths due to COVID-19 aren’t being added to an underlying total that’s in line with the five-year average, but to a total that’s lower than the five-year average due to the fact that we’re spending more time in our homes. The relevant counterfactual is a comparable lockdown absent coronavirus and nothing like that has ever happened.
International comparisons aren’t much help when it comes to determining the true number of COVID-19 deaths because different countries use different ways to collect data on coronavirus deaths and some countries are changing the way they record deaths from one week to the next. Australia, for instance, has changed its definition of a COVID-19 “case” – and therefore whether to list coronavirus as the cause of death – 12 times since January 23rd. All of this makes it hard to calculate how many lives have been saved by the lockdown.
Update: ONS Data for Week 14 (March 27th – April 3rd)
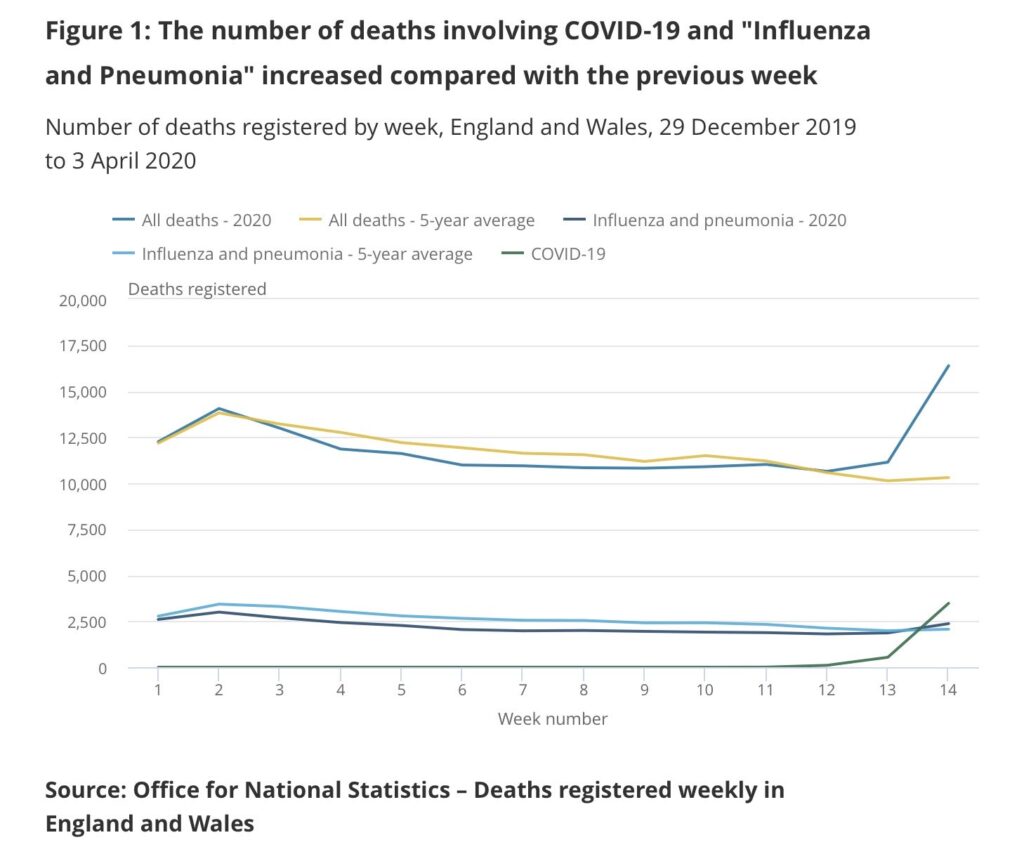
This data, showing a sharp increase in the number of deaths in Week 14, strongly suggests that COVID-19 is more deadly than seasonal flu. The five-year average for Week 14 is 10,305, whereas the number of deaths in England and Wales in Week 14 in 2020 was 16,387, and will be larger still in Week 15. Against this, if Professor Spiegelhalter is right, many of the people who died of COVID-10 in Week 14 would have died later in 2020 anyway from another cause. By the end of the year, when we have all the data, we may conclude that the effect of the virus will have been to squeeze deaths that would have otherwise have been spread out over the course of 2020 into a narrow window in March/April, without increasing the total.
Further Reading
‘How deadly is the coronavirus? It’s still far from clear‘ by Dr John Lee, The Spectator, March 28th 2020
‘Tracking the coronavirus: why does each country count deaths differently?’ by Elena G Stevillano, El Pais, March 30th 2020
‘Coronavirus: How to understand the death toll‘ by Nick Triggle, BBC News, 1st April 2020
‘Coronavirus: seven questions for public health post-mortem analysis‘, Niall McCrae and Roger Watson, Journal of Advance Nursing, April 6th 2020
‘Keeping the coronavirus death toll in perspective‘ by Heather Mac Donald, The Hill, April 17th 2020
‘Why you can’t trust the UK’s “daily” Covid19 updates‘, Off-Guardian, April 23rd 2020
‘Pennsylvania Forced To Remove Hundreds Of Deaths From Coronavirus Death Count After Coroners Raise Red Flags‘ by Amanda Prestigiacomo, Daily Wire, April 25th 2020
‘Coronavirus deaths: how does Britain compare with other countries?‘ by David Spiegelhalter, The Guardian, April 30th 2020
‘Is the lockdown killing people?’ by Hector Drummond, Critic, May 1st 2020
‘The virus that turned up late‘ by Alastair Hames, Hector Drummond, May 9th 2020
To join in with the discussion please make a donation to The Daily Sceptic.
Profanity and abuse will be removed and may lead to a permanent ban.
If you factor in a % of deaths that would of happened due to more cars on the road and activity related ones then minus the deaths incorrectly labelled with C-19 the period Jan-April 2020 will be one of the lowest in UK history! And we are locked in our homes for what exactly?
Google very quickly tells you accidental death is 2.5% of deaths typically. So, 250 a week, Jan-Apr would be 4k, and we already have 13k deaths in hospitals and ONS reporting perhaps nearly twice as many…
SIMPLE EXERCISE!
Ask your local funeral director has he been busier in 2020 with COVID than he was in 2019 with no COVID?
The answer I got was: “No it’s much the same as last year”!
It was the VOODOO VIRUS that killed people!
I called a few. I live in a small city in southern Spain. The first said pretty much the same: “same as other years”. Two seemed to be too busy. Another said “yes, we’ve had an increase in services” [8-9/day at peak days in March/April compared to 4-5/day]. Two didn’t want to give information.
Conclusion? I’d say there is an increase in deaths, but, not enough (by far) to warrant the lockdowns.
By now we should have some data concerning home births for example which are not safe when complications arise.
I have cancer and my treatment has been postponed. How do we count the deaths that will occur?
We do know pneumonia and heart attack deaths have fallen off a cliff.
30,000 beds were created which means the same number of patients were sent home, presumably prematurely
We know attendances at A&E are down by 2 thirds which can only mean sick people are still at home and a % would surely be very ill.
GP surgeries not really seeing patients.
Dental surgeries not open.
It now transpires that medical imaging is not really happening, so brain bleeds, breast cancer, bowel cancer etc are not being diagnosed.
I missed my treatment because the whole NHS has been turned over to the virus. Back in 2016 23,000 people died in a flu epidemic which nobody remembers because we didn’t lock the country down and throw millions out of work.
Most complications in childbirth are caused by interventions.
So How many deaths will we see because of the delayed diagnosis? Should we add it to the other side of the scale? I think so. Did anybody think about how the damage in the economy of the first world countries will affect the third world countries? I see a chance that we will see much more deaths in third world countries than in the rest of the world together.
I’m an ER doctor in the US. We are seeing about 25% of patients we normally see. People are staying home with chest pain and shortness of breath out of fear of coming to the hospital.
I also see no change in deaths due to influenza per CDC statistics. Why is what we are doing not flattening the flu curve?
It’s not just their fear, it’s that GPs refuse to see patients with respiratory illnesses and heart disease symptoms
Those with underlying conditions are having worsening of them if infected by Covid
But the GPS diagnoses only by phone
How can oxygen Sat devices and stethoscope sounds be observed over the phone?
They can’t!
GPs say ‘you’re not dying so it’s not an emergency’. But it will be so without timely intervention
But then, in the Brave New World of the able bodied -the chronically ill, physically disabled are burdens. Hence- walk or bike to work
Evidence-UK Nice calculate physical disability, age over 60, and underlying conditions as to whether patients receive hospital care. Elderly pushed to sign DNRs via scripted GP conversations
FYI. I’m borderline at 8
Very interesting. Though there are clearly vast numbers of excess deaths in Italy and Spain and New York City etc. Enough to overwhelm their hospitals in all cases. So the Coronavirus is not just another winter flu or similar illness. Given that some areas, including huge Asian cities like Seoul and Hong Kong, have only had a handful of deaths each their methods should be studied carefully by everyone everywhere else.
Interesting that you mention NYC John. The usual suspects had been running ‘New York Emergency Rooms are like War Zones’ type of headlines until a few ‘citizen journalists’ turned up at the ERs mentioned (with their time and date stamped film) to discover the ‘war zones’ were actually completely deserted.
I’d love to believe that, but my main source for recent NYC news is the New York Post, which is not one of “the usual suspects”.
Weekly averages are misleading, particularly in winter months. Deaths come in waves as infections and other events shift forward deaths and cause excess deaths. There then tends to be a few weeks with fewer than average deaths. What infections tend to do is to cluster deaths which would otherwise be spread out, e.g. without an infection, say 500 people a week over 80 die of a heart attack, for 2,000 in one month. The infection reduces heart attack deaths to 250 a week, and but kills 750 in each of two weeks. Thus we would normally see weekly deaths tolls of 500, 500, 500, 500 but instead we see 750, 750, 250, 250.
There is therefore nothing magical about any given week. If that particular week in the previous five years had just happened to be “down” weeks, then an “up” week with an infection could appear to be huge. But over 4-6 weeks, it would not be.
What will show us the truth will be the cumulative number of deaths by perhaps the end of May, when everything will have caught up and the winter waves will have finished.
Two things:
1) The graph stops at week 12, which is week ending March 20th, whereas the text talks about week ending March 27th. This is important as it is week 13 where the 2020 number started moving considerably higher than the five year average. As in 10% (or 1,000 deaths) higher.
2) I think it would be beneficial to do this analysis now another week’s data is available. Now showing total deaths 59% higher than the 5 year average for week 14.
Here’s a link with the latest data and graph.
https://www.ons.gov.uk/peoplepopulationandcommunity/birthsdeathsandmarriages/deaths/bulletins/deathsregisteredweeklyinenglandandwalesprovisional/weekending3april2020
I think this week’s ONS figured – 16,000 deaths where you would expect 10,000; highest weekly total on record should put paid to this line of argument.
And yet the update is “By the end of the year, when we have all the data, we may conclude that the effect of the virus will have been to squeeze deaths that would have otherwise have been spread out over the course of 2020 into a narrow window in March/April, without increasing the total.”
That’s now quite a big maybe, especially when the increase in deaths is spread between all age groups from 45 upwards.
In the same period, only around 3,000 of the ‘extra’ deaths have been attributed to COVID-19, so there are 3,000 ‘extra’ deaths that cannot be explained. Although this doesn’t include much of the lockdown, it includes the period people started working from home and distancing.
What about suicides, drug overdoses, etc? They are skyrocketing. Japan had more people suicide last month than died “with” “Covid”.
In truth there is no such thing as an ‘extra’ death: we are talking in every case of premature deaths.
If a significant number of people die earlier (from COVID, or any reason) than they otherwise would have, then at some stage in the future there must be a period of lower than usual deaths (ie, below the curve on the excess mortality charts)
All very interesting. It’s worth noting that the Sweden figures always flatten at the weekend and resume on the weekday. Willing to bet that’s more to do with data collection and reporting than the virus taking it easy at the weekends.
And a few days after April 12th, they reported one hundred seventy deaths from the Commie Virus. Oh, btw, according to the Swedish figures on Worldometer, everyone waits till the same day once a week, and then they all recover that day. See https://www.worldometers.info/coronavirus/country/sweden/.
I don’t know if Sweden is deliberately manipulating data, or just sloppy about reporting it, but their DAILY figures are completely bogus.
Not manipulating, they’re quite open about the fact that these are deaths that entered report stats that day, not the number of deaths that day. The UK is the same.
Has anybody tried to calculate deaths produced by lockdowns?
Supposedly a Whitehall analysis that came up with 150,000 (these will be much younger on average than the COVID-19 deaths)
An undertaker in Redhill told me that on a normal weekend he collects up to 2 to 3 bodies. Last weekend he collected 18. There may be reasons for this other than the Covid virus, I don’t know, but I’m putting this here for your consideration.
Cumulative mortality for 2020 is still below 2018 for the period to 03 April.
Distribution by age is bang on normal
https://www.ons.gov.uk/peoplepopulationandcommunity/birthsdeathsandmarriages/deaths/datasets/weeklyprovisionalfiguresondeathsregisteredinenglandandwales
The same is true right across Europe
https://www.euromomo.eu/
At least one UK overflow hospital, just set up, is not now going to be opened.
There are medical papers written over the last few years showing that coronaviruses, rhinoviruses, that cause the common cold are more deadly to the aged and vulnerable than influenza.
https://www.ncbi.nlm.nih.gov/pubmed/28134768
The government has confessed to having been led by public opinion. Public opinion is being led by groupthink within the broadcasting organisations.
The truth will soon become embarrassingly obvious to too many people as lockdowns melt away elsewhere in Europe
Meanwhile the reputation of the fourth estate, never high, has already sunk through the floor.
https://www.kekstcnc.com/media/2568/kekst-report-16apr2020.pdf
The cumulative mortality argument really doesn’t sit well with me. People have today’s 13.7k hospital figure in their mind as they read this, but all-mortality data in all countries lags hospital data by about 2 weeks so the ONS week 14 figures really only include 3.5k of those. Plus, this argument relies on comparing 2020, a mild-weathered weak-flu-strain year, to 2018 the worst in the last 10 years seeing Storm Emma and a strong flu strain, so that by week 11, and before Covid deaths start, 2018 was 15k deaths ahead of 2020, so you’re comparing apples with oranges. Without Covid 2020 would likely have been a low death year, they can vary by 50k. All of this makes it very easy to hide 6k of extra deaths so far, but with the lag difference confuses people into thinking this means with all 13.7k deaths included. Worse still, because we know there is the 2 week lag and what the week 15 & 16 hospital numbers are, we can already estimate based on ONS week 14 data that these will likely see at least 20k deaths in each, bringing 2020’s week 16 cumulative total to 206k vs 198k in 2018,… Read more »
There is no Covid mortality ‘reality’, only a series of figures produced by different agencies on wildly differing sets of premises. That is why the international range of mortality figures is so wide as to be completely meaningless; no basis for comparisons whatsoever. Meanwhile, in Britain, overflow hospitals are either almost empty or have never even opened. That speaks volumes regarding the model on which this national panic has been based.
I am with you, though, 100% regarding the mortality effects of lockdown.
As the great German epidemiologist said: we have all been spooked.
The national enquiry to follow will have to be robust in the extreme to abate the fury that is to come once detailed data sets become available making absolutely clear the severity, or rather lack of severity amongst the able bodied , of this coronavirus.
What kind of drivers position someone to think: “I am prepared to prejudice this world system which supports so many lives and is contributing to dramatic improvements in lifespans, because I feel sorry for the deaths of a vastly smaller group of people who on average have already had a long life.” Or: “I realise by restricting my way of life I will prejudice this entire world system that supports so many billions of us, 99% of whom will survive even under the worst predictions, but I am afraid for myself and the elderly and vulnerable that I know and so I will vote into it anyway.” Or, “I am unprepared to examine or consider the efficacy or necessity or relevance of lockdown in order to prevent the attack and undermining of the world system which supports all of our lives.” We have changed alot in 80 years, and I think a 1940 war mentality or a pre-1940 instinct for well-being or common good prioritisation a la “women and children first” would well have been in order. The divine coincidence perhaps is that 80 years is the average age of those dying, which only serves to ring out this generational… Read more »
Dr Jenny Harries DCMO: CV-19 recorded deaths are not all due to CV-19: 5 April 2020
Peter Hitchens Tweet: https://twitter.com/ClarkeMicah/status/1248644646248632327
Dr Jenny Harries, OBE, Deputy Chief Medical Officer for England.
United Kingdom COVID-19 Briefing Transcript April 5
https://www.rev.com/blog/transcripts/united-kingdom-covid-19-briefing-transcript-april-5
Jenny Harries: (41:21)
Now for the UK, these are COVID-associated deaths. They are all sad events. They will not all be a death as a result of COVID, but certainly we need to be sure that we are counting everything appropriately and being very clear and transparent on that. So we will continue to track and monitor this and learn from other countries where we can.
The weather is mild this year, we have been washing hands more and social distancing, so 2020 mortality was undertracking the average by ~400 week 4-10, and is very predictable by week.
Week 14 is 59% above the 5yr average, 65% over trend, a 7.1 stdev move. Non-Covid respiritory deaths up 35% too having been undertracking similarly, likely undiagnosed Covid. More worryingly 2.5k unexpected deaths remain unexplained? Some likely people too scared to visit hospital, but are we missing many cases?
Week 15 & 16 on hospital death numbers already accrued are twice those in week 14, and if ONS reporting follows the same trend we are likely to top 20k deaths in each week, more than 2x those expected, with this set to continue for a few weeks.
Given the distribution of fatality by age (14.8% 80+, 8% 70-79, 3.6 60-69, 1.3% 50-59, etc) spreads much younger than Flu, the claim these would all have otherwise occurred this year seems very unlikely. Sure the biggest number will be from this year, but would healthy people in their 30s with asthma have died this year?
Read further… http://bit.ly/2VraWJW
One week in January 2018 had 15,000 deaths, an earlier week this year had 14,000 deaths. In Europe weekly figures for deaths were distorted by the Easter weekend.
As remarked above, mortality comes in waves from these infections and a series of high weeks are almost infallibly followed by low weeks.
The key is cumulative mortality over an extended period and that is, for 2020, still below 2018.
That makes the lockdown just plain silly.
Let us not forget that the ‘batty’ model on which this hysteria is based comes from the same team that caused the unnecessary slaughter of millions of perfectly healthy animals during the 2001 foot and mouth outbreak. A review of that matter concluded: ‘The UK experience provides a salutary warning of how models can be abused in the interests of scientific opportunism.’
The fact of the matter is that we, in Britain, are waiting to see what happens as lockdowns melt away throughout the rest of Europe. It remains to be seen how that will play with voters, but firm and decisive leadership in this country may very well be judged to have been lacking.
Answering your observations in turn… Week 52, 1 and 2 figures are always consistently skewed straddling all years because of holiday reporting. Week 52 is always about 2-3k lower and week 2 a similar amount higher. The 15k week in 2018 was week 2, as was the 14k week earlier this year, it simply wasn’t actually that high. If you look at the plots in the detailed analysis in the link above you’ll observe the pattern much better. Your argument that peaks in death lead to equal troughs cannot hold true if some years are to see much higher total deaths than others, they can vary by 50k deaths. Sure there are troughs, but for example if you look at the plot of 2018 data (follow the link) Storm Emma saw a peak of 2k additional deaths in weak 10 and 11 followed by a much smaller trough relative to that year’s trend never mind to the average. If a year is colder, or a flu strain stronger, like in 2018, there will be overall more deaths that year. People simply won’t make it another year. What marks this virus out from Flu though is that mortality is being spread… Read more »
… typo in second last paragraph, should read 1/10 not 1/20.
Epidemiologists across the world are queueing up to denounce the lockdowns. There quite clearly is no Covid 19 mortality ‘reality’. There cannot be since there are no internationally recognised procedures for the recording of cause of death. Covid 19 mortality in Britain has been inflated from the point at which it was made a notifiable disease, 05 March. Most recorded Covid 19 deaths are ‘with’ not ‘from’ Covid 19 in Britain. So any purely numerical analysis of UK Covid 19 mortality is bound to be flawed. We know that the model is ‘batty’ already because of the disastrous effect it had: the unnecessary slaughter of millions of livestock during the 2001 foot and mouth outbreak in Britain. What could be more ‘batty’ than that? ‘Use and abuse of mathematical models: an illustration from the 2001 foot and mouth disease epidemic in the United Kingdom.’ ‘‘The progress of an outbreak of FMD is extremely difficult to predict in the early stages of the disease. The course of an outbreak can be critically affected by minor and inherently unpredictable events, such as a single livestock movement. For this reason, predictive disease models, which depend on statistical probabilities of transmission, have not met… Read more »
But don’t listen to me……if there was ever any danger of that. Check out this new bit of modelling. I’d be interested in your views. It comes to the following conclusions: ‘..very little gain, in terms of the projected hospital bed occupancy and expected numbers of death, of continuing the lock-down beyond April 13, provided the isolation of older and vulnerable people continues and the public carries on some level of isolation in the next 2-3 months, see Section 3.1; • in agreement with [1], isolation of the group of vulnerable people during the next 2-3 months should be one of the main priorities, see Section 3.2; • it is of high importance that the whole population carries on some level of isolation in the next 2-3 months, see Section 3.5; • the timing of the current lock-down seems to be very sensible in areas like London where the epidemic has started to pick up by March 23; in such areas the second wave of epidemic is not expected, see figures in Sections 2.2 and 3; • the epidemic should almost completely finish in July, no global second wave should be expected, except areas where the first wave is almost… Read more »
Tim Bidie you confirm what I have started to suspect.
Quick question? Is it true that the public health or ONS figures could be potentially wrong due to their being a potential for duplicate death registrations. This could potentially happen due to those who die at home and those who die in hospital. From my understanding public health declared this in their last update but I’m not sure?
Globally 1,250,000 people died in car accidents last year. Yet we build more roads, make more cars and invite more death. The Government are a disgrace. Lockdowns actually prolong the existence of the virus, immunity comes from exposure, and even after a lockdown herd immunity will take time, meaning the virus will be out there for longer than was ever necessary.
Another point when the likes of Hancock talk about saving lives and that all lives are precious NICE put a price on human life every single day. Pathetic.
Hello all, have just joined the site having seen Toby’s article in this morning’s online Telegraph. Hopefully momentum gained here can help lead to a return to sanity, and away from the mass panic that has been created by much of the journalism and government approach in the UK. Obviously I am filled with confirmation bias on reading the articles here, but it is an enormous relief to realise I am not alone in my fears that we are being misguided and misrepresented. I was an early adopter of the ONS data, and have been discussing with my family (including two early teens) since end-Feb that the cruel, hard realities of life are that people die, and about 600,000 of them per year. So when representing death and mortality rate data “it’s all about the denominator” in the maths. It is easy to present data in a way to fit a particular argument, and I think the mainstream public are being totally misled about mortality rates. Clearly this virus is aggressive, and clearly there is a peak of deaths, but no-one yet knows whether some or all of these would have been in the 600k run rate – and we… Read more »
The scientific adviser to the Italian minister of health, Professor Walter Ricciardi, had this to say regarding Italy’s mortality rate:
“The way in which we code deaths in our country is very generous in the sense that all the people who die in hospitals with the coronavirus are deemed to be dying of the coronavirus […] On re-evaluation by the National Institute of Health, only 12 per cent of death certificates have shown a direct causality from coronavirus, while 88 per cent of patients who have died have at least one pre-morbidity – many had two or three,”
He went on to say:
“I want you to remember these people died WITH the coronavirus and not FROM the coronavirus”
BrianJR I have not yet seen a single piece of reported data that informs the UK public in a simple to read format on: A) the total number of deaths recorded in a given week (most seem to settle on a 0 baseline) B) the variance to the 5-year average for that week C) the age profile of any significant variance to the average D) whether or not those recorded in the variance had significant underlying health issues that were already being treated. E) what the likely life expectancy was of those affected. In addition to to all of that, please read… The UK’s daily reports of deaths in hospitals does not represent the total deaths in UK hospitals for any given day. Even though they are sensationally reported as such. For example, using the latest “daily data” reported yesterday 18 April, from this link for England and Wales we read the following description: https://www.england.nhs.uk/statistics/statistical-work-areas/covid-19-daily-deaths/ This section contains information on deaths of patients who have died in hospitals in England and had tested positive for COVID-19 at time of death. All deaths are recorded against the date of death rather than the date the deaths were announced. Interpretation of the… Read more »
Excellent update on this, and potentially a further shocking example of how this data can be used for dramtic effect, and not sensible, balanced information to help ease the terror across the masses.
One thing we need to be sure of though, is how this tallies to the ONS data, which is the real acid-test data as it is all deaths regardless of coding – and it is this one that really matters.
I can see that the 888/784 coding of COVID-19 is a cumulative “tot-up” of numerous days’ data, but would all of the historic element of the 784 have already been recorded as deaths in the relevant week of the ONS data, or are they also new, and if so has the ONS data been updated also ?
Just want to be sure the denominator I use to rationalise this data is a constant.
2,500 extra non-Covid deaths in a week! Collateral damage from the lockdown?
http://inproportion2.talkigy.com/collateral_judgement.html
Or, a sign of our chronic undertesting for Covid outside hospitals? Both equally likely.
The hope is that with higher testing capacity, in community deaths will be tested better, reporting will get more accurate over the weeks, and we can get a better answer. If the lockdown is causing more non-Covid deaths, we need to know.
I agree Simon – both are good reasons, and both are probably true, and it’s going to be impossible to discern which death is which. I will note that the ONS COVID category is quite generous, in that it doesn’t require a positive test, just clinical observations.
I also note that this assumes that all COVID deaths are excess; is this a reasonable assumption? I’d be very, very surprised that literally no-one who contracted COVID, on average, would have died this week anyway – especially in care homes, which obviously suffer quite high daily death rates anyway. That adds even more unexplained deaths, although, again, impossible to say how many.
This exchange neatly sums up our predicament. Since we do not know which deaths are ‘from’ rather than ‘with’ Covid 19, we have no idea of the severity of this virus.
The only real litmus test of its relative severity is a comparison of cumulative mortality for the same period from all causes over the past few years, and that indicates that this virus is no worse than many others:
http://inproportion2.talkigy.com/
Recent antibody tests bear that out:
https://www.forbes.com/sites/davidnikel/2020/04/21/sweden-600000-coronavirus-infections-in-stockholm-by-may-1-model-estimates/#26d1efe578d6
So the current pandemonium makes Britain seem a bit like Churchill’s description of Russia:
‘I cannot forecast to you the action of Russia. It is a riddle wrapped in a mystery inside an enigma……’
Hopefully the Britain of today has at least one real similarity to the Russia of Churchill’s time, as he went on to say:
‘……but perhaps there is a key. That key is Russian national interest.’
Tim, again your misguided point on cumulative numbers. Read my piece above, your argument is poor data science. To summarise… on Gangelt mortality of 0.37% and all the confirmed deaths to date (about 18k) we have 7.3% spread, with carehomes being not really that much ahead, maybe 1%. So even if all the deaths were due to happen this year, this means 92% of the population are free from infection and to keep dying for the rest of the year in the ways they were always going to. So there will not be the trough you expect, as this excess mortality has only been sourced from 8% of the population, and I think in exceptional ways that has taken deaths from future years. Sure the biggest number will have come from this yeat for sure. … and as to the other threads argument that we can lift the lockdown as infections won’t go beyond 15%, the 60% on the de Gaulle has really quashed that idea. More importantly, Covid infection might ceiling at worst in the UK at 65% of the population, but all cause mortality ceilings at 100%. So even if we let it spread to herd immunity, it… Read more »
“… investigate/research credible estimates for lockdown mortality”.
This is the mantra of the empiricist, not the rationalist: the demand for ‘data’ or ‘evidence’. It’s dumb and mechanical – and usually simplistic and wrong. No one has ever shut down the modern global economy before, so no one can produce the credible estimates you say you want. So we have a vacuum of leadership and decision-making. But common sense would tell you that what we’re doing is probably quite a bad idea.
It used to be that politicians and people who were generally wise knew the limits of statistics – you may have heard a well-known phrase but clearly not understood what it meant!
It’s the reason we haven’t elected scientists to run the country – until now. It’s a real shame that our government has become so craven to ‘the science’ (probably a St. Greta thing) that they have simply handed over control to people who are not wise, but dumb and mechanical in their outlook. Not all scientists are like this, but the ones the government is listening to seem to be.
Why insult people?
I’m perfectly rational and pragmatic. The lockdown is killing people, I think we should move out as quickly as we can, my gut like yours is tell me that we will be struggling to estimate this well.
… but trying to use poor stats to argue down a clear source of deaths to win an argument about how your gut is feeling is… irrational.
There is no vacuum, they just aren’t telling you and you.
Read between their lines…
They are waiting for 100k a day tests (that is why they extended the lockdown, mainly), they will then make you install an NHS contact tracing app and link the two services together hoping (as no one has actually tested this apart from the Chinese) to be able to far more aggressively than the Germans managed with human investigated contact tracing to be able to suppress r0 to really low numbers having lifted the lockdown.
My guess they will also pivot on face masks once we are making more here to further suppress r0.
You may be right. And also about the app having NHS branding to make it seem friendly and caring.
Germany is run by a scientist. How are they doing?
There are no valid Covid 19 statistics, data, so the modelling read outs are hopeless, overflow hospitals empty, staff idle. ‘That’s why, when Britain had 590 diagnosed cases, Sir Patrick Vallance, the government’s chief scientific adviser, suggested that the real figure was probably between 5,000 and 10,000 cases, ten to 20 times higher.’ The only valid data are, consequently, overall cumulative mortality rates. Nothing else is worth the paper it is written on. ‘The simplest way to judge whether we have an exceptionally lethal disease is to look at the death rates. Are more people dying than we would expect to die anyway in a given week or month?’ This is why: ‘In the current climate, anyone with a positive test for Covid-19 will certainly be known to clinical staff looking after them: if any of these patients dies, staff will have to record the Covid-19 designation on the death certificate — contrary to usual practice for most infections of this kind.’ ‘There is a big difference between Covid-19 causing death, and Covid-19 being found in someone who died of other causes. Making Covid-19 notifiable might give the appearance of it causing increasing numbers of deaths, whether this is true… Read more »
If you can include ‘global’ figures it will be more intriguing, the third world will be hugely impacted, with UN stating it will be a famine of biblical proportions, partly as no one will have any money to spend suporting the food agency. second is the millions of workers out of work, we are now no longer buying any clothes or other products made in these countries. They are on a few $/day, and will not get any support. They won’t suffer much from COIVD as a) they have very young populations, and B) healthcare is rudimentary, so far fewer vulnerable people
This is going to be MILLIONS of deaths….
Thomas, as this piece…
https://medium.com/pragmapolitic/anyone-for-ons-covid-hockey-a5b43a83fca8
… of analysis of week 15 ONS numbers I just penned concludes, it looks like the 3k unexpected deaths in week 14 has reduced to about 2.1k in week 15 as likely in-community testing has increased. So we have that about 3/4 is Covid and 1/4 is unclassified, and all over and above what was expected.
In order for fear-induced deaths to be big enough to mean what you say and that Covid deaths have taken the place of normal deaths, the fear-induced deaths would need to be larger than 2.2k, which is entirely possible, we don’t know without death certificates clearly categorising things like they do with Covid.
That said, looking at the ONS data, in-the-home deaths are up from 2.7k in week 11 to 4.1k in week 15, so up 1.4k, with all the rest being in carehomes/hospices, etc (managed settings with more sensible judgement), so the likelihood that fear-induced death is > 2.2k seems low.
Bear in mind accidental death is 2.5% of all deaths so a noise term.
What do you make of the fact that only 38 per cent of Covid-19 deaths in week 15 were recorded as from pneumonia, down from 42 per cent in week 14? Does that suggest death with rather than from and from a different cause?
Also, two thirds of additional care home deaths and three quarters of additional deaths at home in week 15 (which have spiked hugely) didn’t mention Covid-19.
Perhaps of interest is to look at this by age. The over 65 will have predominantly more deaths from COVID, however in the same way that NICE looks at QALY, what about the young, has their life expectancy decreased? Suicides, Homicides etc. I’ve read somewhere that for a man in his 40’s to lose his job, will result in a reduction in life expectancy of 1-1.5 years (millions have lost their jobs). Reduction in GDP will have a similar effect on life expectancy, and once you consider the chief medical office stated that 2/3rds of deaths are people who would not lot live more than 1 year anyway (and most of that year will have been in poor health), then you look at the number of ‘years of life’ lost, and it will become a compelling argument.
Two thirds of the week 15 spike in care home deaths didn’t mention Covid-19. Also only 38 per cent of all Covid-19 deaths in week 15 mention pneumonia. Some questions need answering here. I’ve written on this here https://faith-and-politics.com/2020/04/21/two-thirds-of-spike-in-care-home-deaths-not-with-covid-19-whats-really-killing-people/.
I’ve already email the ONS as I think they’ve made a notes error in their circular. If you look at my article for in detailed explain… https://medium.com/pragmapolitic/anyone-for-ons-covid-hockey-a5b43a83fca8 … but essentially in some parts of their release repiratory totals MAY include Covid induced Pneumonia, but in other parts they do NOT include covid induced pnuemonia in repiratory counts, but on just numbers the way they’ve labelled it makes no sense. As in… – in their spreadsheet the MAY include wk14=1965 and wk15=1810 – in their summary plot that does NOT wk14=2367 and wk15=2003 Something looks fishy to me. Bear in mind to confuse us all even more in the week15 release they revised down the week14 respiratory total in the spreadsheet from 2016 to 1965. So we have to read into that, and my best read would be some Covid pneumonia being double counted, can’t be all as how did they have 2367 in the plot!? I think they’ve got there notes the wrong way round, like I say I’m waiting on an email reply to know for sure. Either way the article you pasted seem to be looking at the higher number and assumes they are all Covid deaths!? Have… Read more »
I’m glad you’ve contacted them for clarification. I thought this crucial point was as clear as mud in their report. I wondered whether some doctors weren’t putting pneumonia as well as Covid-19 even when pneumonia was involved – but that would obviously be contrary to guidance.
My piece on this on Conservative Woman is up tomorrow morning.
Where did your 2333 of 6213 Covid deaths had pneumonia stat come from?
Ah, I see what you mean, in the text of the website and not in any of their actual data downloads, thanks ONS, really helpful. Still don’t see how whether roughly 2/5s of Covid patients also having a secondary infection of pneumonia or not informs us in any way as to the legitimacy “from” rather than “with” of any of the deaths. Given doctors (as per the article I pointed out)… https://inews.co.uk/news/health/coronavirus-covid-19-patients-death-certificates-nhs-trust-2541936 … can distinguish between primary causes and noted secondary infections, and they have been doing this for hundreds of years. They know full well not mislabel death as it will be confusing to those interpretting them for policy, there is no great scandal going on, and if you’re implying their doing it to increase funding then I really have no time for the argument. Further, the ONS release is a summary. I’d assume the more detailed dataset contains this distinction, and people use it. As to the broader point about what was the contributing factor of death, given we know the expected mortality of any week follows pretty tight patterns… read my detail data scientist review of week 15 here… https://medium.com/pragmapolitic/anyone-for-ons-covid-hockey-a5b43a83fca8 … it is very statistically unlikely that… Read more »
The main alternative cause of death is some result of lockdown, whether through stress and despair (in the elderly), neglect or not accessing essential healthcare.
Thank you for the explanation about Covid. I had somehow picked up that it primarily killed via pneumonia, so if that is not true and it kills in another way then that may explain why doctors are not recording pneumonia in a majority of cases. I suspect a lot of additional care home and private home deaths are transfer from those that would ordinarily occur in hospital, but you do wonder how many were avoidable.
I’ve read more on this. It does appear that Covid-19 usually kills through pneumonia.
I don’t understand your final conclusion. I think perhaps the confusion stems from what they (and you) mean by pneumonia. As per this NHS advice… https://www.nhs.uk/conditions/pneumonia/ … as much as wikipedia might summarise pneumonia as a more general term for the degradation of the respiratory system, the NHS has clear clinically diagnosed causes that can be tested for, the most common is the bacteria Streptococcus pneumoniae, an infection that can be cured with antibiotics. There are also known viruses, syncytial virus (RSV) and sometimes influenza type A or B, I’m assuming all can be tested for too. As an example reported in the news, the PM was tested, and tested negative so was deemed NOT to have clinical pneumonia, but still came close to critical de-oxygenation of the blood due to the Covid virus. Yes, I’m sure that Covid could be more generally described as a form of pneumonia, but my guess (and we should ask a doctor) would be that death certificates follow the clinical diagnosis of these known conditions. I don’t understand your implication that in the abscence of pneumonia the death must have been caused by fear or panic, and that it was more a death “with”… Read more »
Lung damage. Sounds terrifying. And obviously unique to the Covid-19 virus… But, er, no it isn’t unique. It’s just the same as other types of flu:
“How Flu Damages Lung Tissue”
https://www.sciencedaily.com/releases/2009/07/090717150302.htm
“Influenza virus-induced lung injury: pathogenesis and implications for treatment”
https://erj.ersjournals.com/content/45/5/1463
“Study: H1N1 Flu Causes ‘Unusual’ Damage to Lungs”
https://www.foxnews.com/story/study-h1n1-flu-causes-unusual-damage-to-lungs
Again, none of the Covid freak-out types has ever worried about it before now.
(and I put ‘other types of flu’ just to annoy certain people 🙂 )
Why do you assume I’m on the other side of the argument? I want out of lockdown asap. I just don’t want the rest of the world looking at these arguments and ripping them to bits because most people making them aren’t Data Scientist and have glaring flaws in them. Covid is a type of Flu. I didn’t say either way. I entirely agree seasonal Flu can kill people in a similarly nasty way. I’m perfectly happy for doctors to mark a death as a respiratory failure due to the damage caused by Flu. They mark the underlying condition too, so we can really easily disambiguate the numbers to inform policy. As to your “baiting” post, anecdotal reports from ICU doctors are that Covid is far more aggressive than Flu. Which bears out in measured numbers. Gangelt Covid CFR measured 0.37% of cases, the Flu average is 0.1%. So on a case by case basis it is about 3.7 more vicious. BUT, as to my response to Will, when this nasty death happens to a Covid patient that also happens to have cancer, or asthma, for Will to imply they are all just “mislabellings” of “from” instead of “with”, unless… Read more »
Coronaviruses and rhinoviruses are well known to be more lethal to the aged and infirm. That is certainly not specific to Covid 19. ‘Unexpectedly Higher Morbidity and Mortality of Hospitalized Elderly Patients Associated with Rhinovirus Compared with Influenza Virus Respiratory Tract Infection’ https://www.ncbi.nlm.nih.gov/pmc/articles/PMC5343795/ Coronaviruses and other influenza like illnesses form a significant part of aged and infirm mortality every year. ”These viruses have primarily been associated with mild upper respiratory tract infections, but severe lower respiratory tract infections have also been reported [51, 52]. Diarrhea and abdominal pain may also occur, but symptoms and signs relate primarily to the respiratory tract [53-56]. Chronic underlying conditions and advanced age increase the susceptibility and disease severity of CoV infections, and mortality occurs [44, 53]. In a study of community-acquired pneumonia, most of the HKU1-positive patients were old (median age 72 years) and had significant underlying diseases, especially of the respiratory and cardiovascular systems [18]. One study reported an outbreak of acute respiratory infection in a personal-care home, where CoV NL63 was identified in 7 of 8 patients aged >50 years [57]. One elderly patient died 5 days after the onset of HCoV-NL63 infection. CoV-NL63 and CoV-HKU1 are distributed throughout the globe and… Read more »
Crunching these numbers is a complete waste of time, as an NHS consultant pathologist of many years experience, Dr John Lee, points out: ‘The distinction between dying ‘with’ Covid-19 and dying ‘due to’ Covid-19 is not just splitting hairs.’ ‘This nuance is crucial – not just in understanding the disease, but for understanding the burden it might place on the health service in coming days.’ ‘….there is no international standard method for attributing or recording causes of death.’ ‘Prof. Neil Ferguson of Imperial College London said that he now expects fewer than 20,000 Covid-19 deaths in the UK but, importantly, two-thirds of these people would have died anyway.’ The only question that can be answered with any certainty is whether Covid 19 is an exceptionally lethal disease, as Dr Lee again points out: ‘The simplest way to judge whether we have an exceptionally lethal disease is to look at the death rates. Are more people dying than we would expect to die anyway in a given week or month?’ Not only is it quite clearly not an exceptionally lethal disease, as epidemiologists the world over are queueing up to tell us, but we have even declassified it, on 19 March,… Read more »
A silly question maybe, but do we actually *know* that the figures are honest and above board? Is it possible to trace the death certificate of everyone who appears in the figures, and prove that it is real? A few months ago, I probably wouldn’t have questioned it, but when we get to a position where information itself is seen as jeopardising Our NHS, why *wouldn’t* the authorities fiddle the figures? We know 100% they’re quite prepared to fiddle the numbers on Covid-19 deaths themselves so why not the mortality figures in general? *Nothing* is more important than Our NHS, so why jeopardise it for the sake of a few figures that only geeks are normally interested in anyway?
The latest Intensive Care National Audit & Research Centre (ICNARC) audit of patients with Covid-19 in UK intensive or critical care units (excluding Scotland, paediatric & neonatal intensive care units) reports that by 16 April only 1,499 people have died from/with Covid-19 in these ICUs. https://www.icnarc.org/Our-Audit/Audits/Cmp/Reports (PDF pages 14 & 16)
Just under 90% of the cumulative Covid-19 deaths have occurred in hospital. https://www.cebm.net/covid-19/tracking-mortality-over-time/
But why would so many of the critically ill ‘Covid-19’ patients die on an NHS general ward without being moved to an ICU as they deteriorate? Isn’t the obvious reason that these patients already had other significant health issues and were by that time on palliative care only?
The above CEBM analysis also shows that unusually large numbers of non-Covid deaths have been occurring outside hospital (at home, elsewhere & in care homes) since 31 March.
Most deaths in care homes are not caused by the virus directly (and it is unlikely Covid-19 deaths are understated, given the distortion in the system pro Covid-19 reporting https://hectordrummond.com/2020/04/08/the-onss-covid-19-category/ https://off-guardian.org/2020/04/05/covid19-death-figures-a-substantial-over-estimate/ )
Brendan O’Neill at Spiked highlighted a reported 60% (100,000 weekly) drop in UK hospital admissions (despite the 41% of acute care beds unoccupied). https://www.spiked-online.com/2020/04/16/the-lockdown-is-killing-people-too/ https://www.hsj.co.uk/acute-care/nhs-hospitals-have-four-times-more-empty-beds-than-normal/7027392.article
So perhaps the Lockdown and all the media hysteria are also both big causes of these excess deaths?
NICE/NHS assign a frailty index (https://www.nice.org.uk/news/article/nice-updates-rapid-covid-19-guideline-on-critical-care) so if they don’t make it into ICU they clearly have significant underlying medical conditions. However, it leads to a bigger question for me, on how many of these poorly patients were already in hospital when they caught the virus, and how many of those that were shipped out to care homes to create more ICU space that was clearly not needed (thanks Ferguson!) took the virus into care homes with them. The various changes to the slides used in government briefings: hospital admissions with COVID (https://assets.publishing.service.gov.uk/government/uploads/system/uploads/attachment_data/file/878518/FINAL_Press_Conference_slides_7_April.pdf) to patients in hospital with COVID (https://assets.publishing.service.gov.uk/government/uploads/system/uploads/attachment_data/file/879144/COVID-19_Press_Conference_Slides_-_08_04_2020.pdf) suggests they’re fully aware that lots of patients have caught this in hospitals. More recent PPE issues do not explain the non-ICU hospital deaths over the last month.
NICE write the guidelines (https://www.nice.org.uk/news/article/nice-updates-rapid-covid-19-guideline-on-critical-care) and NHS assign frailty scores to see which patients have a chance in ICU. Sadly many are already too poorly for ICU (underlying health conditions), which supports the pulled forward death hypothesis. However, surely the bigger question here is how many of these poorly patients caught the virus on their hospital bed (ie hospital acquired infection) or whether they caught it in community (under lockdown). The daily briefings reveal that the government is well aware of these nuances switching from “hospital admissions with COVID” until 7th April (https://www.gov.uk/government/publications/slides-and-datasets-to-accompany-coronavirus-press-conference-7-april-2020) to “patients in hospital beds with COVID” from 8th April (https://assets.publishing.service.gov.uk/government/uploads/system/uploads/attachment_data/file/879144/COVID-19_Press_Conference_Slides_-_08_04_2020.pdf). if we knew the answers then surely we would know if the lockdowns have made any difference in the community? The other issue is how much of the care home problem was directly caused by the rushed clear out of general wards, without adequate testing beforehand?
By 23 April only 2,067 people have died from/with Covid-19 in above ICUs. https://www.icnarc.org/Our-Audit/Audits/Cmp/Reports (PDF pages 15 & 17)
Ive seen many anecdotal comments of family disagreeing with eg heart failure reclassed as Covid19 eg https://twitter.com/DominicFrisby/status/1254662872870924290 thread.
What do you say to this https://www.nytimes.com/interactive/2020/04/21/world/coronavirus-missing-deaths.html
Isn’t it obvious that Covid-19 causes excess mortality?
But what proportion of the UK’s excess deaths are caused by Lockin-20 v Covid-19? https://off-guardian.org/2020/04/29/lokin-20-the-lockdown-regime-causes-increasing-health-concerns/
I’ve also seen several anecdotal comments of family & nurses angrily disagreeing with eg heart failure reclassed as Covid19 on dodgy death certificates eg
https://twitter.com/JoanneC52191646/status/1251115347782049795 https://twitter.com/goddersbloom/status/1255563637672030211 https://twitter.com/AngelaReedFox/status/1255111495731548161 https://twitter.com/DominicFrisby/status/1254662872870924290 https://twitter.com/stormcloud2010/status/1256288771248721921
Toby mentioned Thomas Meunier’s study: “Full lockdown policies in Western Europe countries have no evident impacts on the COVID-19 epidemic” which concludes “As a concluding remark, it should be pointed out that, since the full lockdown strategies are shown to have no impact on the epidemic’s slowdown, one should consider their potentially high inherent death toll as a net loss of human lives.” https://www.medrxiv.org/content/10.1101/2020.04.24.20078717v1
It’s all about opinions really – and of course statistics. IMO after all the dust has settled this year will be no worse than a ‘bad flu year’ deaths wise. Of course the big difference being that in the meantime the economy this year will be wrecked – unlike other years…..
I predict It will be three time’s worse than the worst of influenza year on record. Mortality will be 20-25% (125k extra). Higher than a typical year. Come back in seven months and see how I did.
Recent record. I’m not counting 1918.
Lets assume that you are right. Why do we see this illness as something special though and not subject to NICE treatment limit of £30k pet year of quality life? I have done the figures when discussing it with my friends and I am sure others done it as well. So, for simplicity: Economic demage 100 billion (this is conservative, most people assume 200 bilion plus) Deaths with covid 100k So milion pounds of economic demage to not even prevent deaths, per “excess” death. Since 90% of covid attributed deaths are of old, obese and already ill people it looks to me as total madness. I am of retirement age without kids, but destroying young people future and economy to extend old people lives by even 2-3 years is not a rational policy. I perfectly understand political imperative why it was done taking into account prof Ferguson gusses (surely calling it modelling is for the birds) and MSM fanned hysteria. Surely, even if one is against Swidish approach, Hong-Kong and South Korea approach of test, track and isolate carriers looks much more sensible and based on data. Ok,quality of reported data is of variable quality, so happy to see alternative… Read more »
Assume 300k deaths in the absence of intervention, 100k deaths in the presence. And a saving of five years Of life over the entire age range (optimistic). The intervention has saved about 1M life-years. At a cost of, say 100bn or £100k/life-year. That’s 3x higher that NICE guidelines, but not outrageous given the population sensitivity to this new agent.
Lol, and you were so sure … do you feel like a bit of a covidiot now?
Haha pretty concrete proof now that you are wrong, you were predicting 165,000 deaths, being 125,000 deaths higher than the average flu season. We are at the end of September, circa 40,000 deaths ( and that’s those dying with Covid and not of it.
Prepared to eat humble pie and support the anti-lockdown cause?
Sorry, you were predicting 145,000 deaths … only 100,000 out
Great article and great site. I also wrote about related issues a few weeks ago for UKAJI:
https://ukaji.org/2020/04/28/the-emperor-has-no-clothes-a-sober-analysis-of-the-government-response-to-covid-19/
I appreciate that it’s hard to assess risk early on. But we know enough now. This ill-conceived and devastating policy must stop.
Three more weeks data can be added to that graph now. Starting to look alpine.
Tomorrow should show us past the peak. But it makes the previous arguments look pretty facile. There is, however a nice relationship between COVID19 deaths and all cause excess deaths. One can also predict the eventual excess as the first wave of the epidemic wanes.
Have read parts of your comments and Telegraph article today; couldn’t agree more… let everyone loose and let them make their own minds up like adults;
The day the lockdown was announced I went to my pub for a few last beers; the local retired head of practice GP was their and confirmed that most who died would have died within a year; Shame they died earlier but get Covid in perspective Boris.
I’m 70 by the way so supposedly most at risk ; I’ll take my chances.. at the peak the NHS ONLY had 4 deaths a day on average per hospital so accepting a few in London far from over wealmed. .. and that’s without the Nightingales
The UK now apparently has more Covid-19 deaths than Italy.
Italian ex-secretary of state, Vittorio Sgarbi: “According to the National Institute of Health, 96.3% did not die of coronavirus, but of other pathologies, which means that only 925 have died from the virus and 24,075 have died of other things… Don’t lie! Tell the truth!.. The 25,000 dead, as Professor Bassetti said, died of heart attacks, cancer and other… Let’s not use them to humiliate Italy. Let’s not use them to give citizens false news.” https://z3news.com/w/italy-hoax-leader-screams-stop-lying-true-numbers/
As our American friends say: “Go figure!”
BMJ article (highlighted by Toby) ” “Staggering number” of extra deaths in community is not explained by covid-19…
Only a third of the excess deaths seen in the community in England and Wales can be explained by covid-19, new data have shown.” https://www.bmj.com/content/369/bmj.m1931
During the epidemic, it is impossible to report the rate of excess deaths attributable to C19. This is because a lot of deaths that would have happened anyway have been accelerated by C19. We may well see a reduction in excess deaths for the second half of the year because some of the people who would have died have already died. If anyone talks about excess deaths but does not take this into account they are committing the sin of what I call “nowcasting”, using an incomplete data set available now to make a forecast, rather than thinking about how the epidemic will play out and doing a proper ‘fore-cast’
Yoram Lass, former director of Israel’s Health Ministry “Any reasonable expert – that is, anyone but Professor Ferguson who would have locked down everybody when we had swine flu – will tell you that lockdown cannot change the final number of infected people. It can only change the rate of infection.” https://www.spiked-online.com/2020/05/22/nothing-can-justify-this-destruction-of-peoples-lives/ Epidemiologist Professor Sunetra Gupta: “In almost every context we’ve seen the epidemic grow, turn around and die away — almost like clockwork. Different countries have had different lockdown policies, and yet what we’ve observed is almost a uniform pattern of behaviour which is highly consistent with the SIR model. To me that suggests that much of the driving force here was due to the build-up of immunity. I think that’s a more parsimonious explanation than one which requires in every country for lockdown (or various degrees of lockdown, including no lockdown) to have had the same effect” https://unherd.com/2020/05/oxford-doubles-down-sunetra-gupta-interview/ Prof Martin Kulldorff, medicine professor at Harvard Medical School: “Because of its virulence, wide spread and the many asymptomatic cases it causes, Covid-19 cannot be contained in the long run, and so all countries will eventually reach herd immunity… If exposed to Covid-19, people aged in their 70s have roughly… Read more »
This could be way off the mark–a crude calculation and analysis I know. I just got curious about the excess deaths being reported in Guardian. So I looked up the Office for National Statistics. In England the excess deaths for April 2020 as compared to 2019 are 44030. The COVID deaths recorded for April are 24346–whether you agree with that is another matter. That leaves 19684 extra excess deaths in April. Is the lockdown working?
I was wondering is it only me who can see the madness in lockdown. I see the experts are still saying we should have gone into lockdown earlier when it’s obvious with each day that goes by the experiment as failed to save any lives at all. For example if the U.K. had followed Sweden’s model we would have suffered only 25000 deaths and not the 40000 plus. Now I know so called experts will say you can’t compare the U.K. with Sweden but the fact remains lockdown was designed to save lives and it’s done the complete opposite. I wouldn’t normally have different views to the government but since YouTube took down the interview of two doctors in America for having different views to the WHO. I’ve come to the conclusion main stream media are not interested in different views so will be watching and reading less of their propaganda in the future.